Urgent decision making using ensemble simulation and in-situ analysis with ParaView Catalyst
HPC architecture can be exploited in order to help with urgent decisions like responding to disasters such as wildfires, hurricanes, extreme flooding, earthquakes, tsunamis, winter weather conditions, and accidents. This context is fully described in the following article [1], written during the VESTEC project where Kitware Europe was a partner. The main idea that will be developed in the following, is to exploit HPC abilities to launch several simulations of the same event, with varying parameters. Using topological analysis on the different results, analysts should be able to get an overview of the probable outcome, helping them to make the right decision to save lives.
Ensemble simulation analysis
When working on chaotic events, a single simulation as detailed as it can be has a few chances to be a good prediction. The idea here is to use a large number of simulations, with slightly different initial conditions, and extract the events occurring in most of the realization scenarios.
A simple example of such analyses is given in Figure 1, relying on minima / maxima to define points of interest:
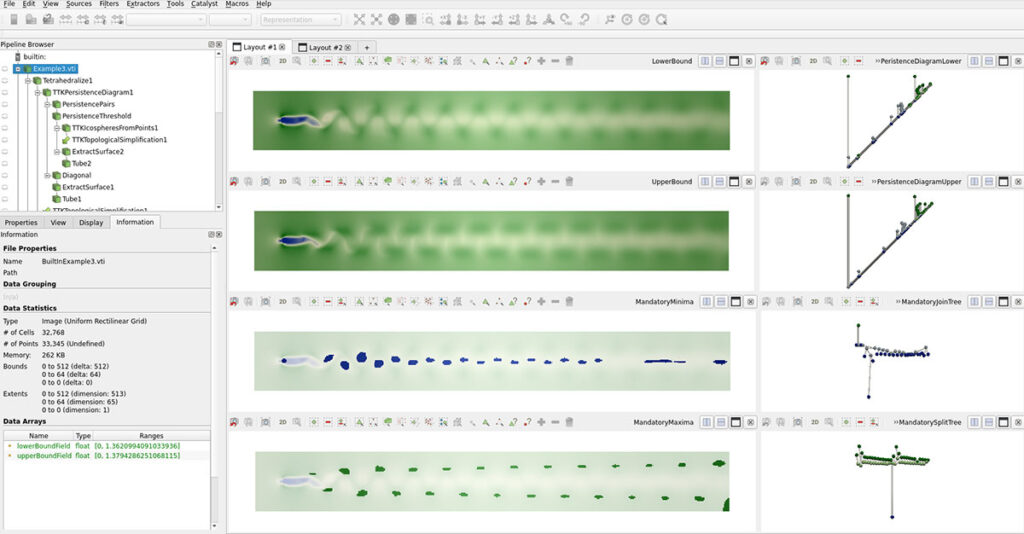
The pipeline given here relies on the Topology ToolKit (TTK) [5] and is a simple example of an ensemble simulation analysis. Here, we extract areas on which at least one vortex occurs for each realization of the simulation. A vortex is a min / max point with regards to the rotational of its speed. This pipeline provides good results when there is only slight turbulence between the realizations. For chaotic events though, we may relax the criterion about each simulation having a critical point in the area, and only consider a given ratio of them. Another approach is to use a clustering approach as detailed next.
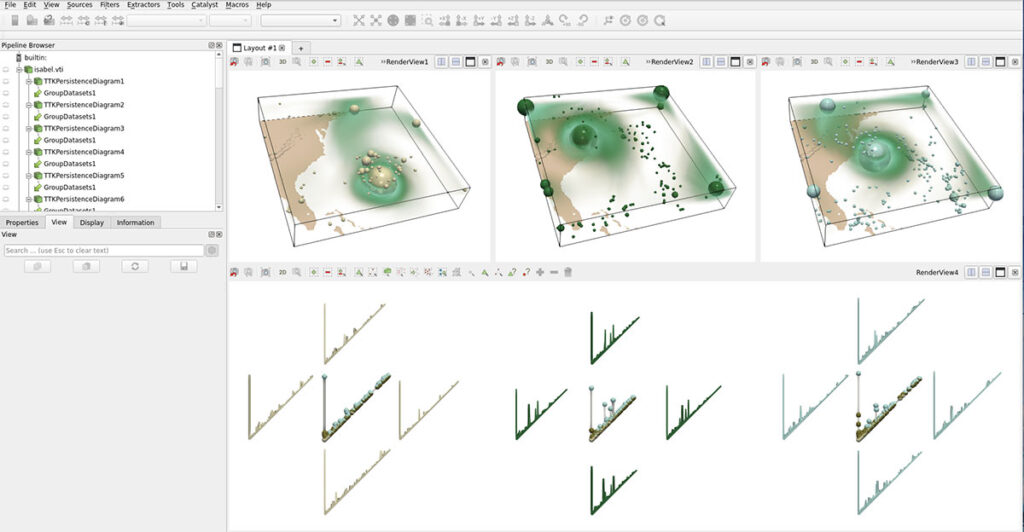
The idea behind the clustering approach is the following: We have a large enough number of realizations, and we try to find those who have similar structures. In the following, we will use the persistence diagram to describe the features / structures. This is the diagram shown on the two right views of the first pictures, and explained here. It is also possible to use the merge tree as a descriptor to capture saddle points information. Using more complex abstractions like the contour tree, the Reeb graph or even the Morse-smale complex is still a research subject.
Figure 2 presents an example of a persistence diagram based clustering. Here, we have a hurricane at three different timesteps. We can see that the clustering has successfully matched the corresponding timesteps together and extracted the average descriptor of each cluster.
Using these approaches we can try to predict the evolution of unstable or even chaotic events. Now, we would like to operate such a pipeline in an urgent context.
In-situ ensemble simulation analysis
The main idea behind this part is to operate the pipeline seen in the first section while the simulation is running. As these simulations are usually run on large supercomputers, we need in-situ abilities in order to analyze them on the fly (see Figure 3).
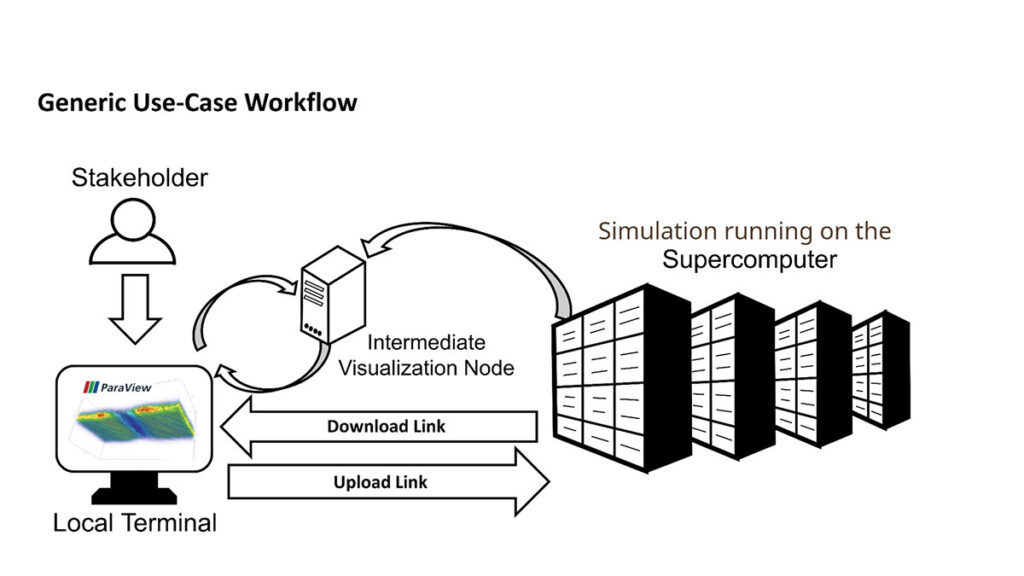
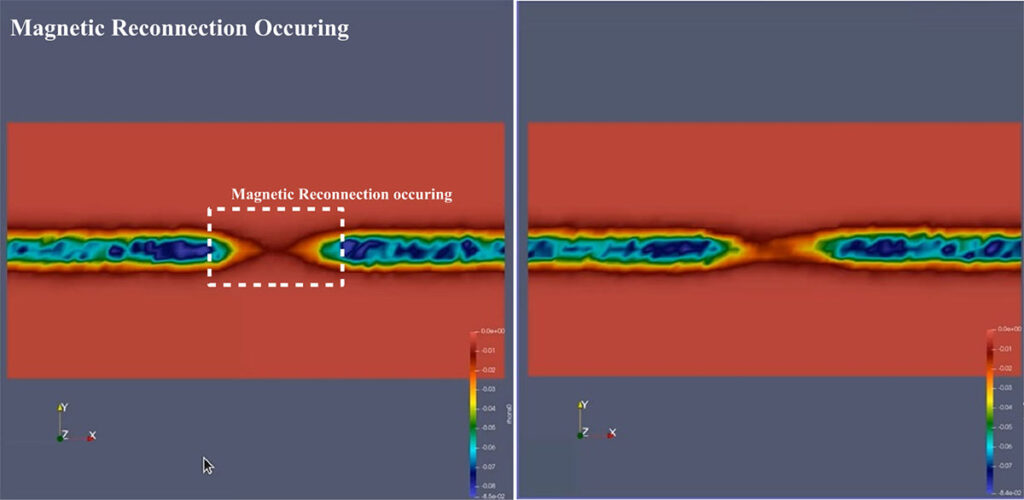
Such in-situ workflow allows us to explore the various realizations as soon as they are available on the supercomputer. The simulation code needs to be instrumented with Catalyst to describe and provide the generated data to ParaView for visualization allowing one to witness interesting events as seen Figure 4:
We can also forge a pipeline to do some analysis on the data. As we are working in-situ, the analysis pipeline can benefit from the supercomputer on which it is running, contrary to the usual post-processing pipeline running on a simple workstation. We can use the pipeline described previously, with the clustering abilities. In order to adapt to the progressive nature of the in-situ exploration, we have developed another visualization.
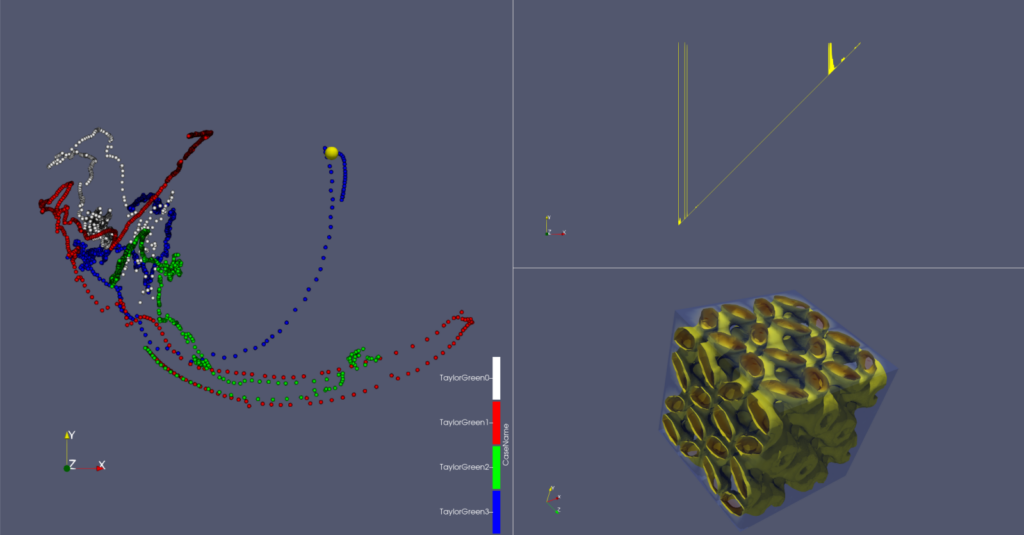
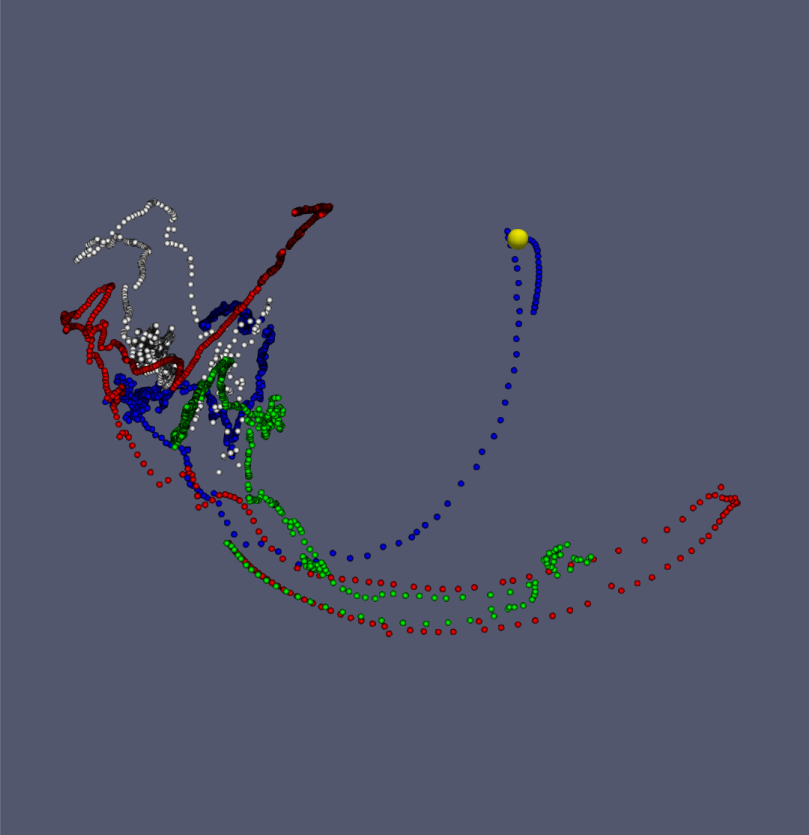
The clustering method we use relies on a dimension reduction step. As shown in Figure 5, we can represent each realization as a point in the 3D space. We have here 4 visible clusters, 2 of them having a high turn that may need further analysis.
All these on-the-fly analysis and visualization benefits from the progressiveness of the computation and can provide an overview of the result before the end of the computation. The user needs to be careful that the corresponding decision is made on partial data, and it may be up to the simulation to order the run so that all the final clusters have a chance to appear from the beginning. This pipeline is presented with much more details in this video.
Conclusion
This blog takes its content from several articles written by VESTEC project members [2,3,4] addressing domain specific applications, like spread of mosquito borne disease, fire propagation analysis and space weather forecast. The described pipeline can be executed on a workstation, or take benefits from a HPC architecture in order to explore a large number of simulations simultaneously. As a future work, we hope to improve the distributed processing abilities of TTK in order to be able to do topological data analysis of simulations with large(r) output data.
References:
[1] Brown, N., Nash, R., Gibb, G., Prodan, B., Kontak, M., Olshevsky, V. and Der Chien, W., 2019. The role of interactive super-computing in using hpc for urgent decision making. In High Performance Computing: ISC High Performance 2019 International Workshops, Frankfurt, Germany, June 16-20, 2019, Revised Selected Papers 34 (pp. 528-540). Springer International Publishing.
[2] Brown, N., Nash, R., Poletti, P., Guzzetta, G., Manica, M., Zardini, A., Flatken, M., Vidal, J., Gueunet, C., Belikov, E. and Tierny, J., 2021, November. Utilising urgent computing to tackle the spread of mosquito-borne diseases. In 2021 IEEE/ACM HPC for Urgent Decision Making (UrgentHPC) (pp. 36-44). IEEE.
[3] Gibb, G.P., Brown, N., Nash, R.W., Mendes, M., Monedero, S., Fidalgo, H.D., Cisneros, J.R., Cardil, A. and Kontak, M., 2020, November. A bespoke workflow management system for data-driven urgent hpc. In 2020 IEEE/ACM HPC for Urgent Decision Making (UrgentHPC) (pp. 10-20). IEEE.
[4] Brown, N., Nash, R., Gibb, G., Belikov, E., Podobas, A., Der Chien, W., Markidis, S., Flatken, M. and Gerndt, A., 2023, January. Workflows to driving high-performance interactive supercomputing for urgent decision making. In High Performance Computing. ISC High Performance 2022 International Workshops: Hamburg, Germany, May 29–June 2, 2022, Revised Selected Papers (pp. 233-244). Cham: Springer International
[5] Tierny, J., Favelier, G., Levine, J.A., Gueunet, C. and Michaux, M., 2017. The topology toolkit. IEEE transactions on visualization and computer graphics, 24(1), pp.832-842.Publishing.