Visualizing point clouds in ParaView

High-density 3D scans of an environment from LiDAR, structured light, and other sources are becoming commonplace. ParaView can be applied as a visualization and processing tool for 3D point cloud data from a variety of sources. This article demonstrates techniques for visualizing 3D point cloud data, especially in the absence of additional information such as panoramic overlay, intensity information, or other contextual clues.
The original data for these examples is provided courtesy of Bastian Steder at the University of Freiburg, Dept. of Computer Science, and made available under the Creative Commons Attribution License 3.0 here.
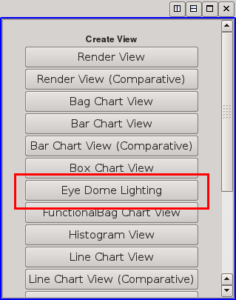
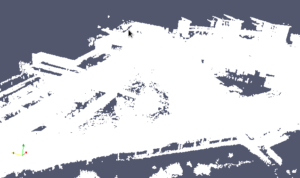
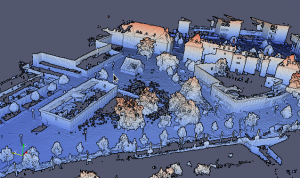
The Eye-Dome Lighting technique is a non-photorealistic rendering technique that can greatly improve the ability to see the underlying structure of the data. To use this technique, ensure that the EyeDomeLightingView plugin is loaded. Then create a new view, selecting the “Eye Dome Lighting” view type. This technique enhances the visibility of edges and other structures from depth information.
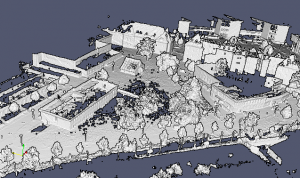
The default rendering of points with additional data (RGB color, intensity, etc.) colors each point as a solid color. With this type of visualization, understanding the structure of the 3D environment is difficult due to the lack of shading clues.
Other common options for assigning attributes to the point cloud can help to visualize the data. For example, coloring the points by height using the “Elevation” filter can help the user to see the structure of the cloud.
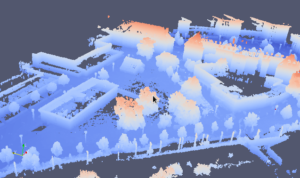
This option also works with the eye-dome lighting view.
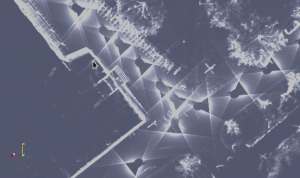
Another option that helps, especially when looking at the data from an overhead view, is to reduce the opacity of the point cloud. In this case, vertical structures like walls appear bright because a significant number of points accumulate to produce the final intensity.
See our LiDAR project site for more information on Kitware’s projects related to LiDAR visualization and analysis, or contact us to see how we can help you with point cloud processing, visualization, and analysis.
Another technique that often works is to increase the point size and reduce the opacity a bit. Sometimes this looks a bit better.