vtk.js: the Visualization Toolkit on the Web


Rendering three-dimensional (3D) meshes and volumetric datasets became possible on the web years ago with the introduction of WebGL. Since that time, several libraries have gained popularity by supporting 3D data rendering in the web browser. These libraries often focus on gaming; they provide little support for scientific visualization and data exploration. As leaders in scientific computing and as developers of the widely used Visualization Toolkit (VTK) and ParaView systems, we wanted to port core features of VTK, including data analysis and visualization algorithms, to the web. To do so, we created the Visualization Toolkit for JavaScript (vtk.js). Today, we are pleased to announce the 5.3.5 release of vtk.js.
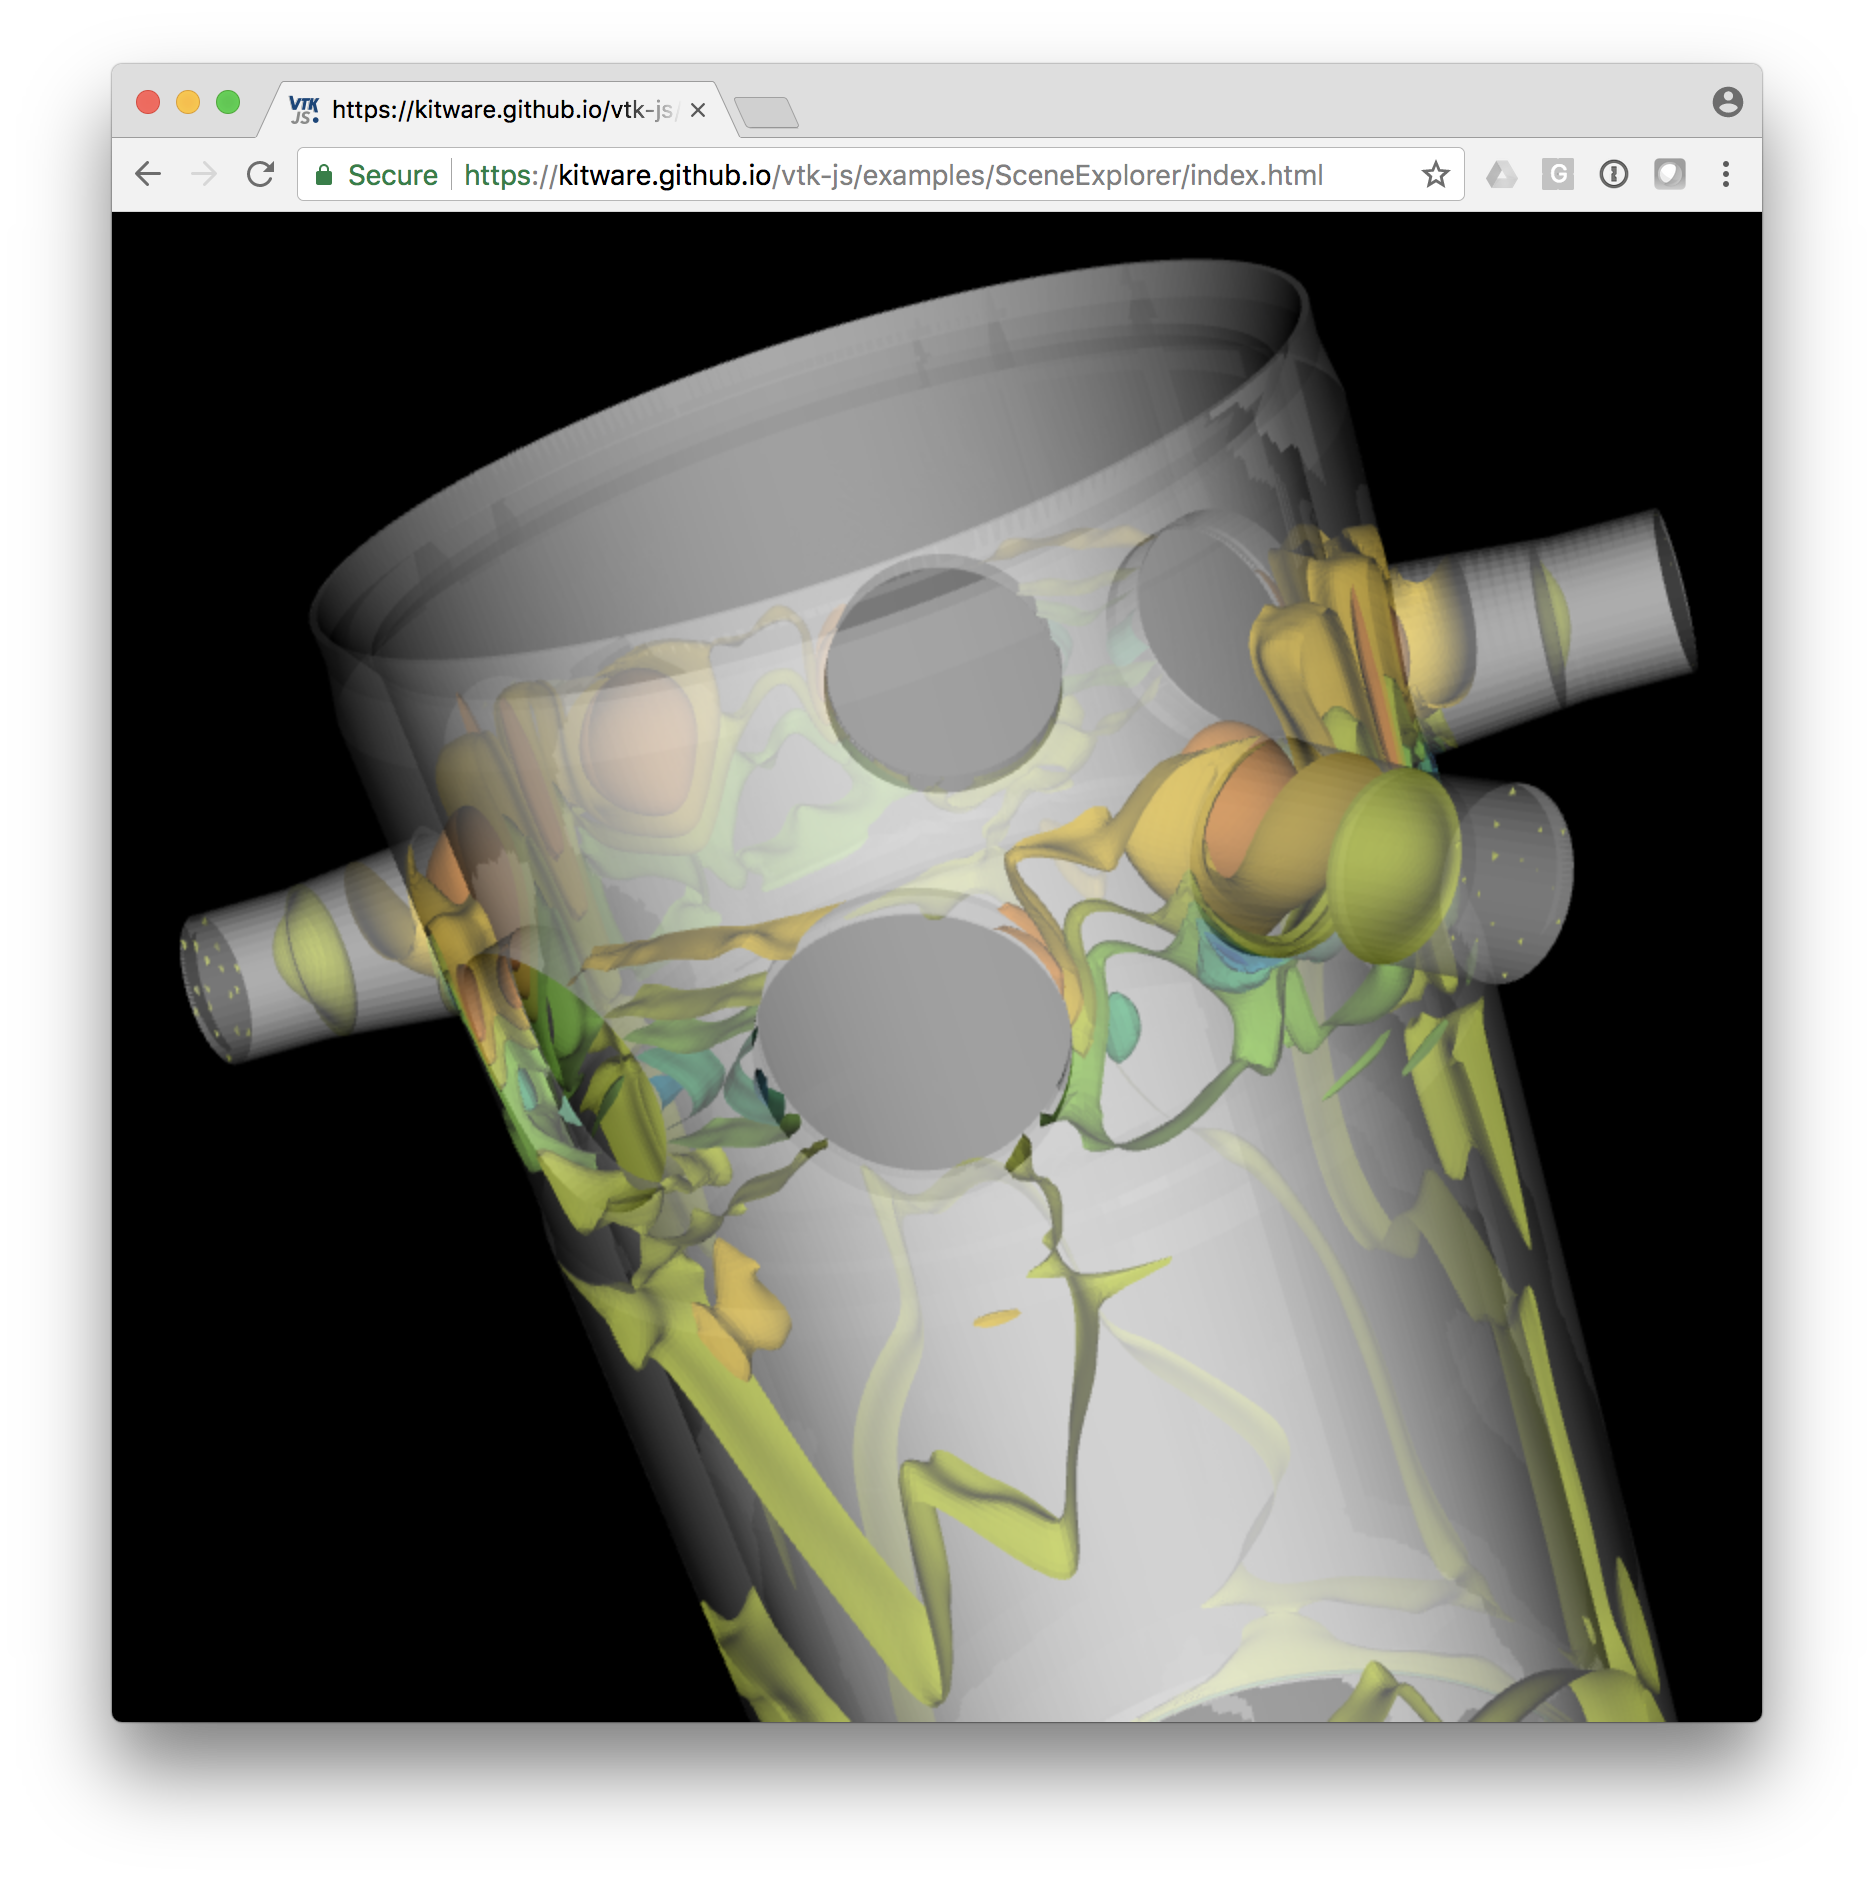
For well over a year, vtk.js has been under development. It now offers a suite of useful capabilities for rendering data on the web, and it is fast and robust enough to support advanced visualization applications (e.g., GeometryViewer, OBJViewer, SceneExplorer and VolumeViewer). The toolkit retains the same concepts and architecture as the popular VTK C++ library, bridging the gap between web visualization and VTK data structures. With vtk.js, vtkPolyData, vtkImageData and other analysis data types can be rendered directly inside of a web browser.
The common mesh representations that vtk.js can render include Point, Wireframe, Surface, and Surface with Edges. The toolkit also allows for advanced rendering features such as volume rendering. While these features work on WebGL 1, they can leverage WebGL 2, if available. In addition, the rendering engine can color data by fields associated with points and cells, and it can handle Not-a-Number (NaN) values, above and below range values as well as pre- and post-processing color interpolation. What is more, vtk.js supports data analysis algorithms such as Marching Cubes (for iso-contouring), along with a variety of common modeling and visualization filters.
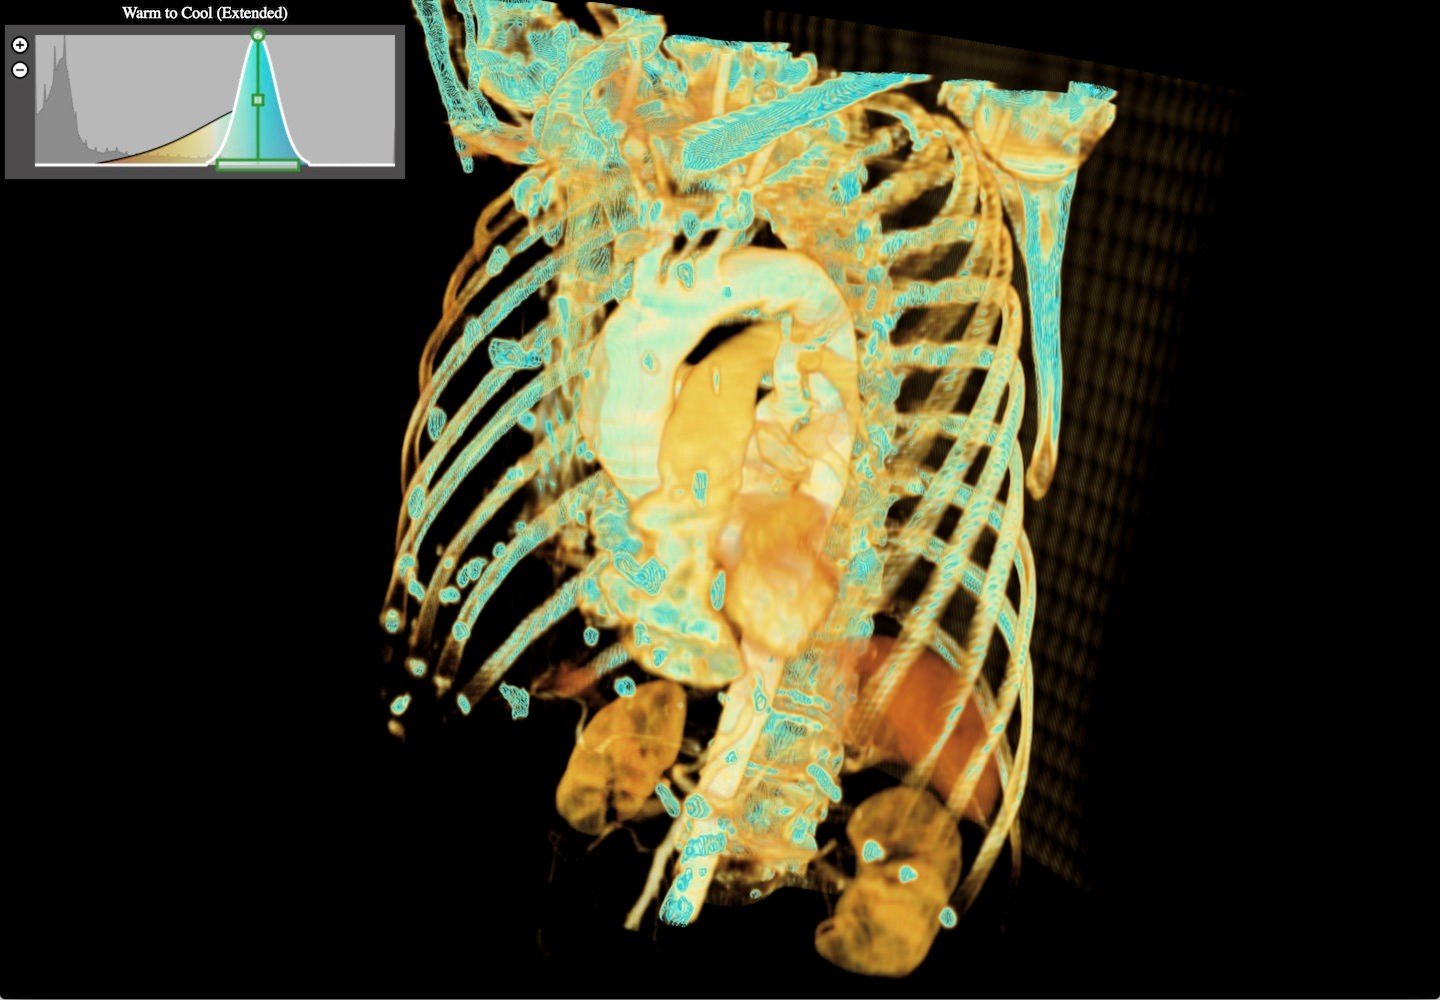
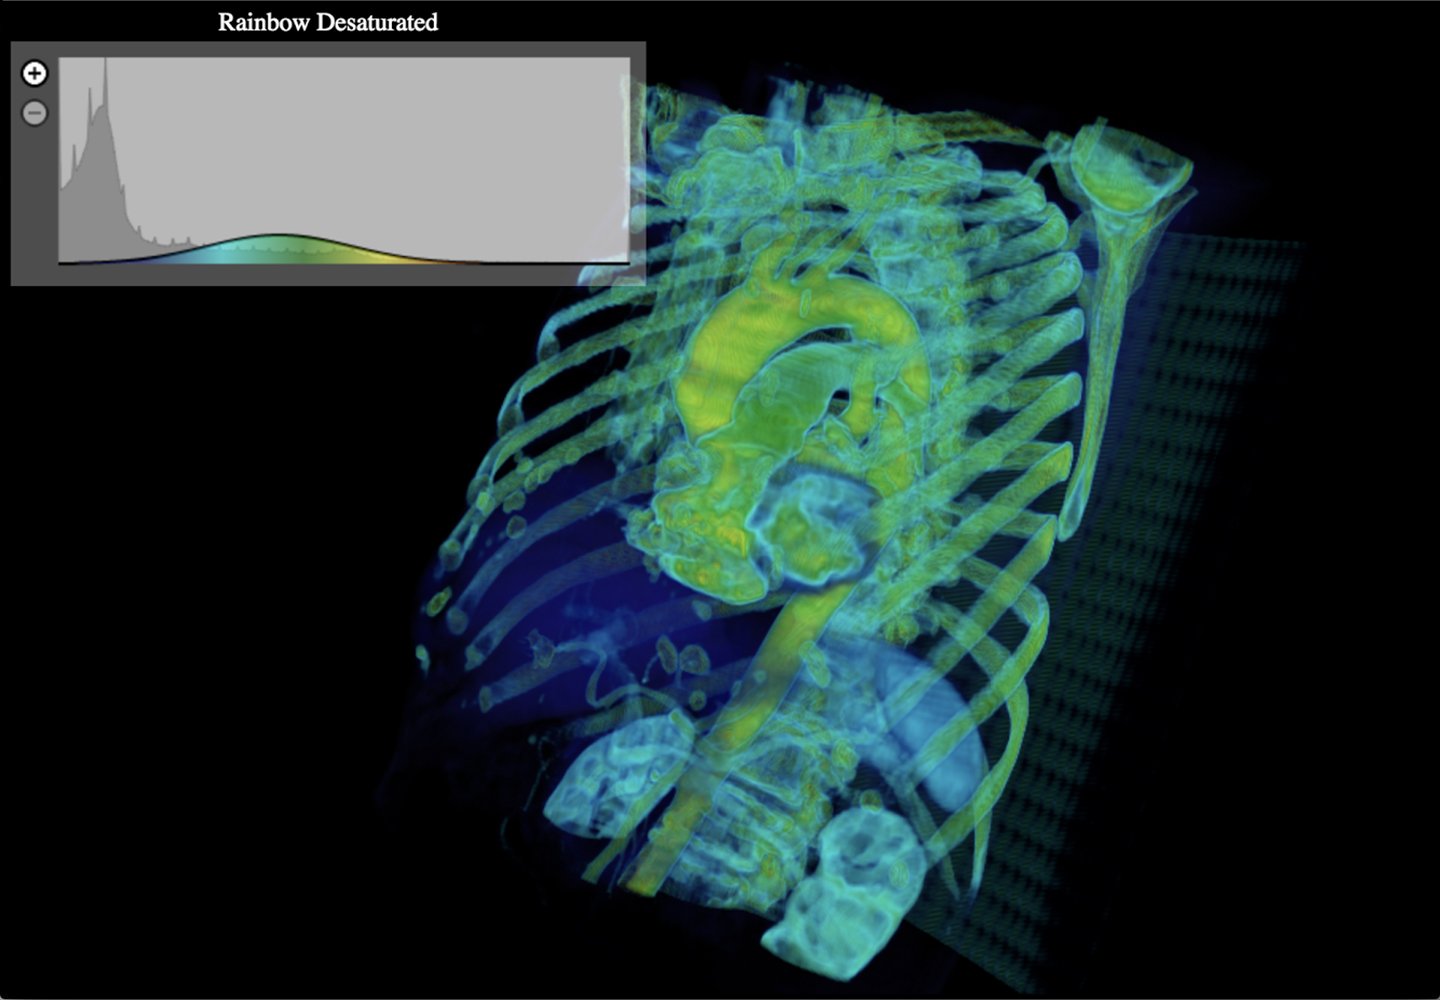
Aside from data rendering, vtk.js offers data interaction through widgets. The below images show a widget that allows you to adjust the opacity transfer function.
Since coding with vtk.js is much the same as implementing a VTK pipeline in C++ or Python, vtk.js is easy to learn and use in the web environment. The library is more than a basic port of VTK into JavaScript, however, as it adds convenience methods to build new classes with associated default values, readily generate set/get class properties, serialize objects to JavaScript Object Notation (JSON), create an instance from a JSON state and much more.
The vtk.js library is designed to work on a wide variety of platforms, ranging from powerful desktops to cell phones. While JavaScript may not always be associated with high performance, we have seen rendering rates of one billion triangles per second on a mid-range laptop (GTX 960M) with a 30-million triangle model. Likewise, with over one thousand actors, we have seen rates reach upwards of 15 frames per second.
Examples with Live Code
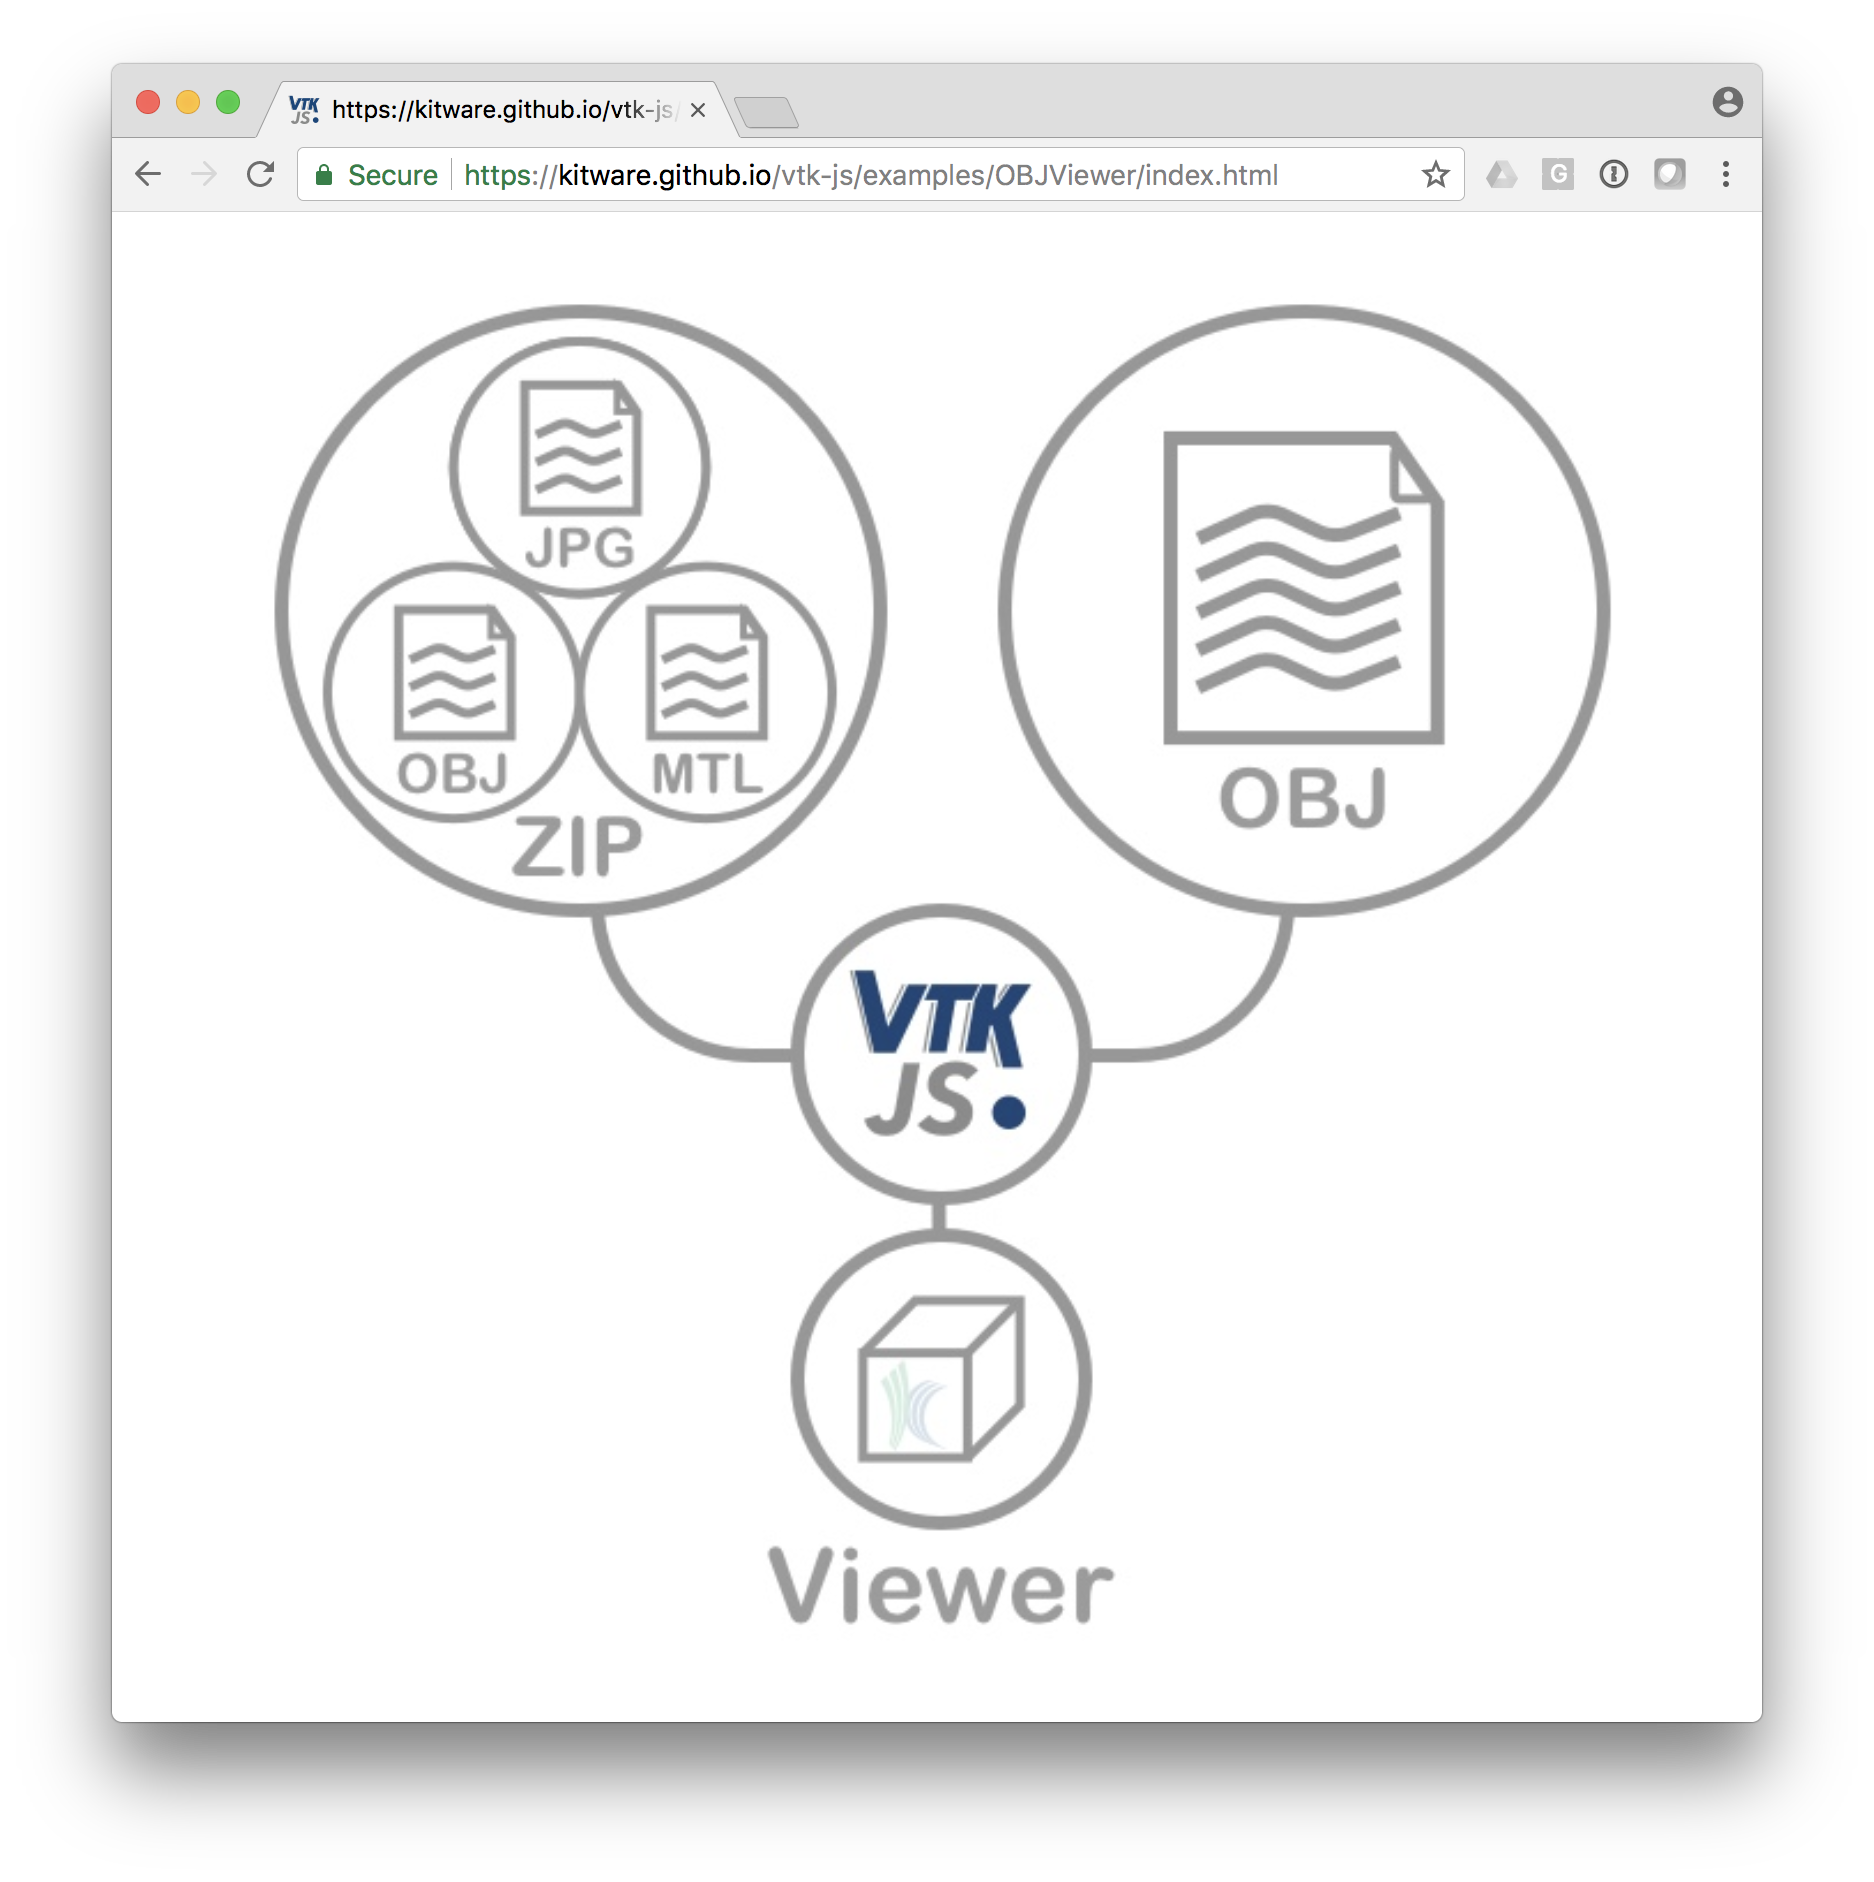
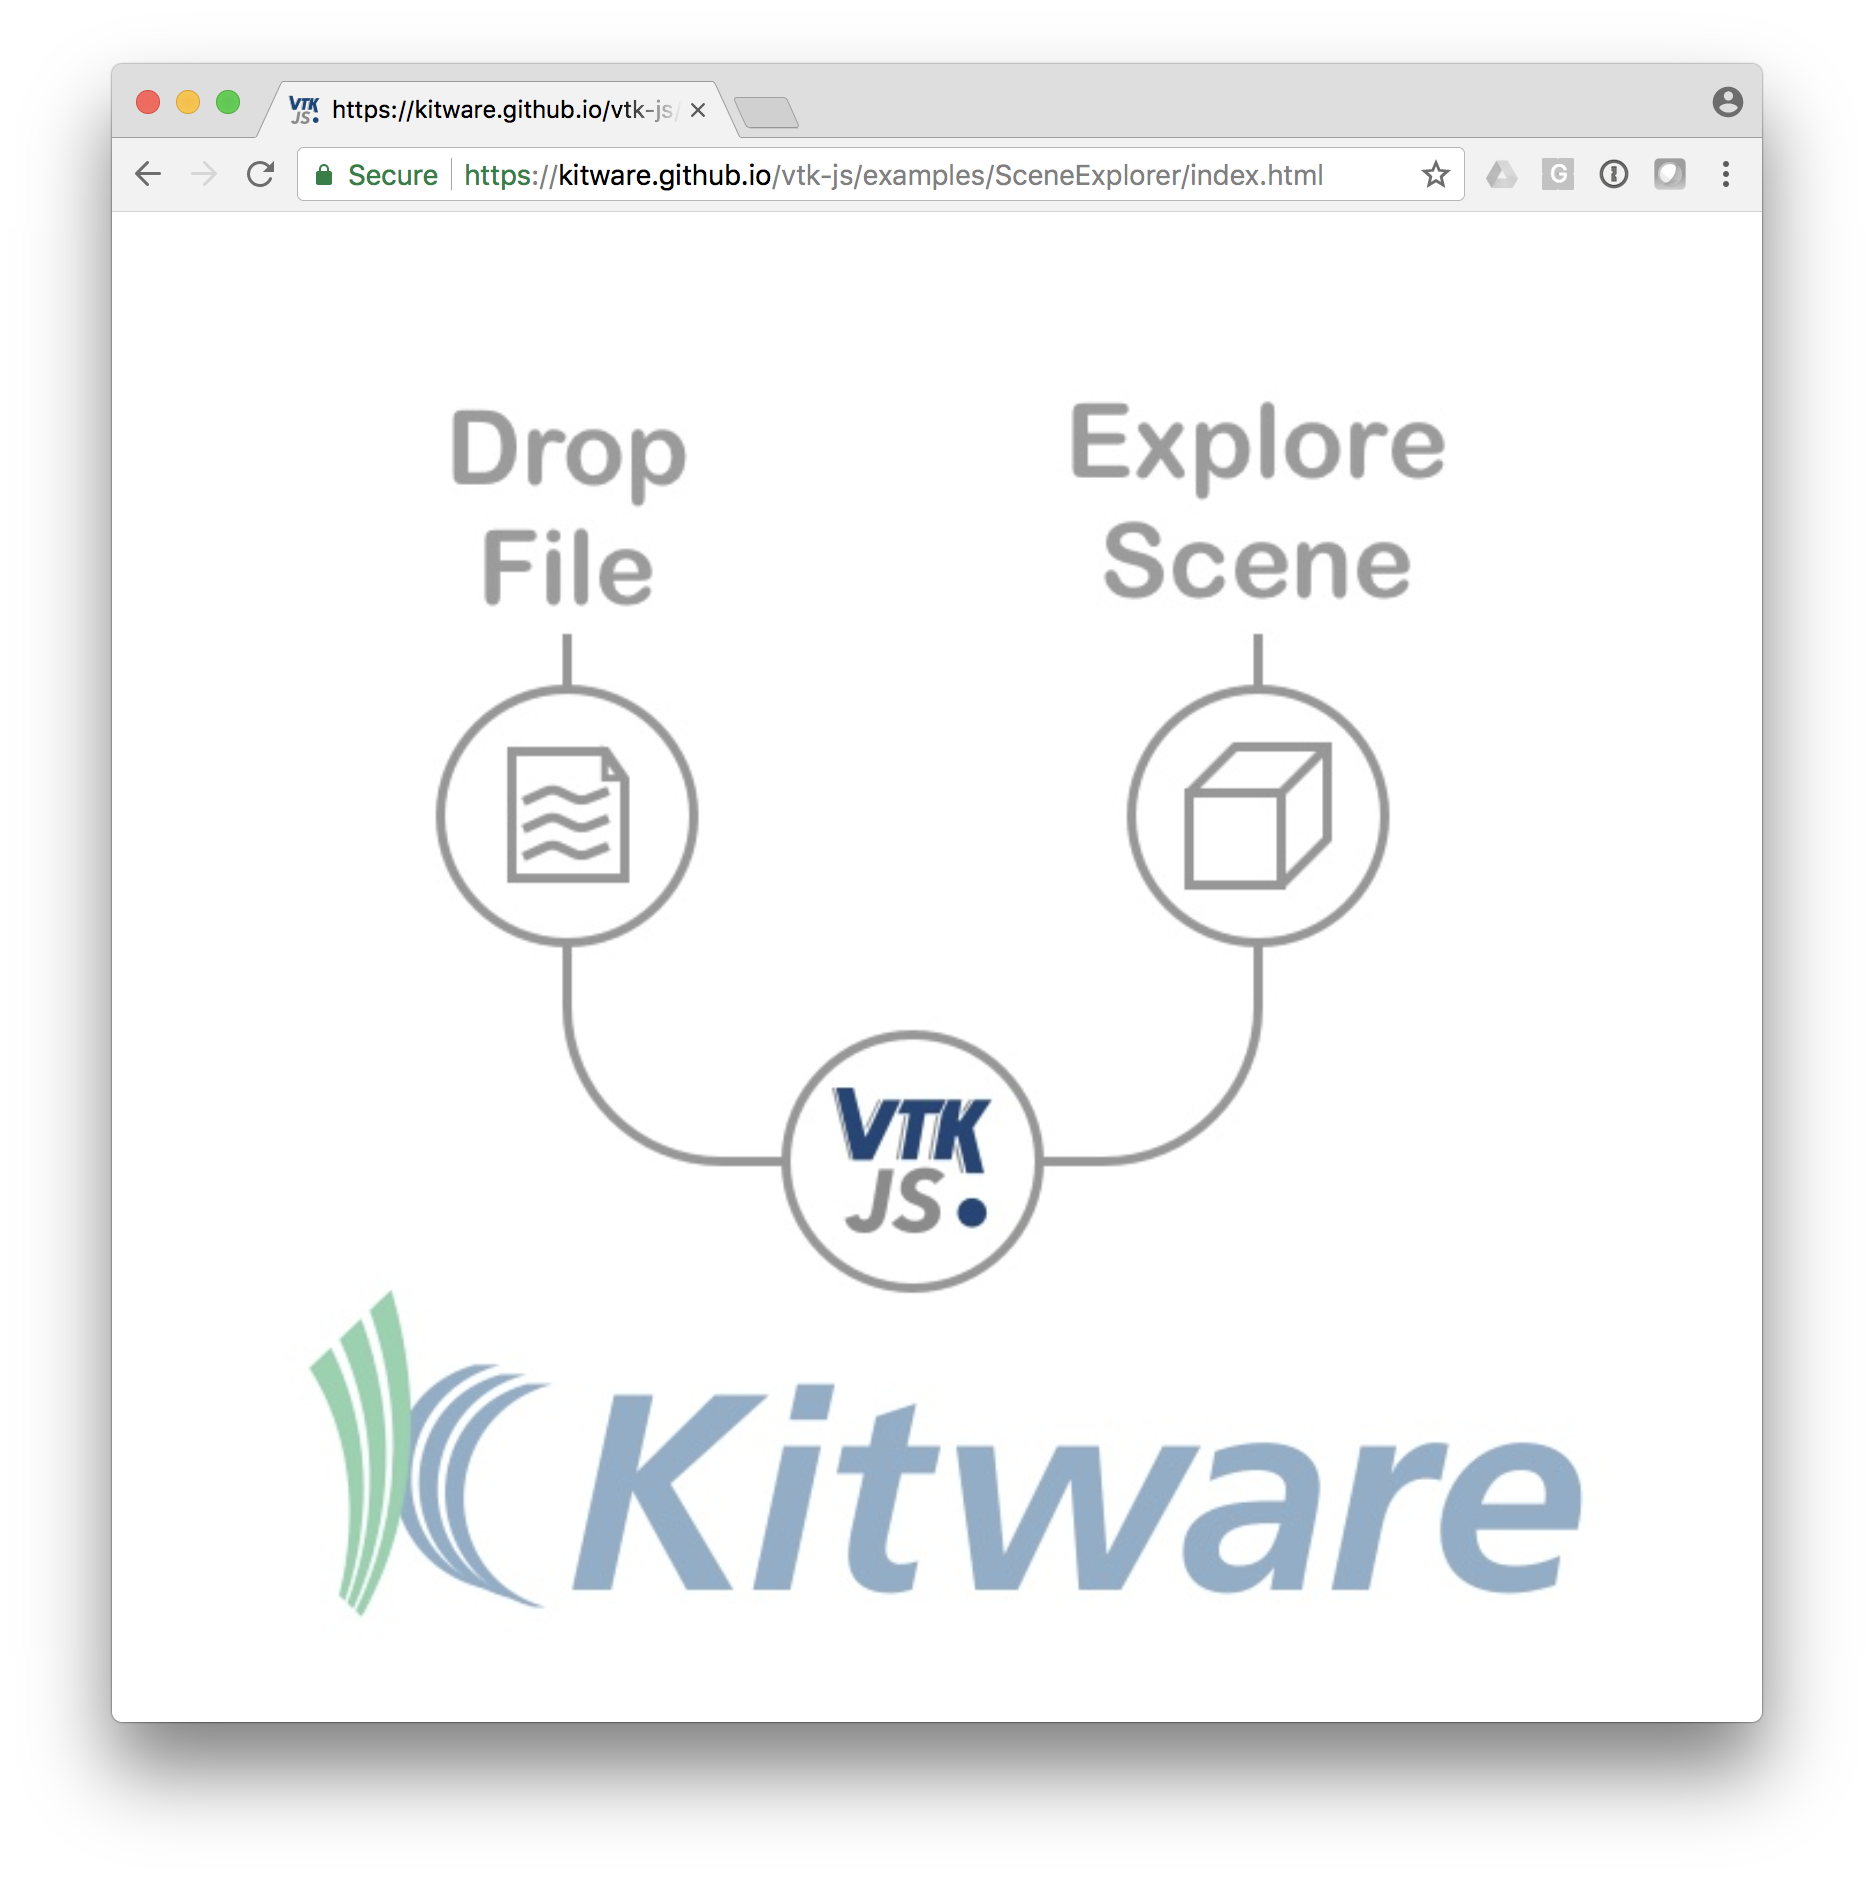
A set of examples with live code is available on kitware.github.io/vtk-js/examples. Some of these examples are full applications; you can use them as standalone HTML files on a desktop (no server required) to view and browse complex data. To get started, just drop your data into the application webpage.
For more details regarding supported formats, refer to the corresponding application descriptions (GeometryViewer, OBJViewer, SceneExplorer and VolumeViewer).

Additional Resources
Documentation is available to help you build an application based on vtk.js using modern toolsets such as Webpack and Node Package Manager (npm).
We are actively developing vtk.js, so new features and capabilities will become available in the coming months. One potential addition is support for WebVR. Stay informed and follow our progress on our GitHub repository.
Really excited about this. Thank you guys
Awesome,we are super exited to use it. Is this compatible with C#/ASP.net mvc core?
I’m not sure to see what you mean by that since it is plain JavaScript.
According to message above, so I can extend vtk.js classes by inheriting from the base classes? I were unable to do so in C# using ActiViz.
You can extend a vtk.js class only in JavaScript by following the pattern described in the documentation here: https://kitware.github.io/vtk-js/docs/develop_class.html
Unless I’m missing a relation that I’m not aware between JavaScript and C#.
It looks very promising! Currently I use vtk to view DICOM files so I’m wondering if Vtk.js will support the DICOM file format in the future?
They are several JavaScript libraries that can read DICOM. So web application could be build to read and visualize such data.
Moreover, ITK can be compiled to WebAssembly or emscripten which means that you can also use ITK to decode various file format and render them using vtk.js…
Here is an example that loads DICOM files with itk.js and visualizes them with vtk.js: https://kitware.github.io/itk-vtk-image-viewer/
do you have a function list comparing the difference between C++ VTK and Javascript VTK?
Anyway, you really did great job!
And, do you have plan to do similar work on ITK? That would be great too!
Hi Jun,
JavaScript VTK currently supports many of the visualization techniques found in VTK, and the coverage is growing. To get an idea of what is covered, check out the API docs:
https://kitware.github.io/vtk-js/api/
itk.js bridges JavaScript with ITK compiled to WebAssembly or fast JavaScript via Emscripten. The entire toolkit is supported. See:
https://www.npmjs.com/package/itk
The documentation is currently under development, and the API is still expected to changed. For an example application, see
https://github.com/Kitware/itk-vtk-image-viewer
We are currently also investigating the possibility of compiling VTK with Emscripten.
Hi guys, I really would like to learn this, im a UI Designer with basic javascript knowledge, can someone tell me where to begin please? Wish there is a step by step tutorial for a total beginner like me. Thanks in advance.
I would start with either of the following guide:
– https://kitware.github.io/vtk-js/docs/intro_vtk_as_external_script.html
– https://kitware.github.io/vtk-js/docs/intro_vtk_as_es6_dependency.html
Here is another example live on codepen
– https://codepen.io/jourdain/pen/RQZWYa
Then once you have the hang of it, you can learn more about VTK on its concepts and data-structures with our book (downloadable for free):
– https://www.vtk.org/vtk-textbook/
hi, I’m chinese.is it easy to combine vtk.js with three.js?
I’m not sure to know exactly how to do it. But I would think it is doable. Although, I don’t think it is strait forward as of right now.
Are there any examples of unstructured meshes?
Rendering can only be performed with ImageData (Volume Rendering) and PolyData (Geometry Rendering). But we are working on bringing VTK-C++ filters into the web via WebAssembly. Once available it will be possible to process unstructured grid and render them via the extract surface filter.
thank you
Came across this comment: Unstructured grid VTK XML files cannot yet be read in by vtk.js readers. Is that still true?
Yes, only Polydata and ImageData can be used for rendering. Unstructured grid will eventually be supported using piece of VTK/C++ compiled into WebAssembly.
Hello, Is it possible to visualize unstructured grid (.VTU) files using vtk.js now? If not, which application would you recommend to use to visualize such files?
You can use ParaView or VTK to extract the outer skin and then render that in vtk.js. But if you want to have full VTK/ParaView capability in the Web, ParaViewWeb is the way to go.
hi,
I have some questions
Windows vtk i can use 3d .tif data
Now to display on the webpage
How to display 3d .tif data using vtk.js,
What format do I need to convert, is there a tool?
Thanks in advance.
You can load your tif stack with ParaView and write it to .vti using the appended+zlib compression.
But I think itk-js should be able to load your data directly. Did you try ParaViewGlance to validate the support of tiff format by itk-js? https://kitware.github.io/paraview-glance/app/
Hello
I have a question.
How to display the coordinate points of SWC file on display of 3D. TIF data with vtk. JS
Are there any relevant forums to discuss such issues?
Hello
I have a question.
How to display the coordinate points of SWC file on display of 3D. TIF data with vtk. JS