VTK.js v26 Release Notes

We are pleased to announce a new VTK.js release, v26!
VTK.js provides interactive visualizations that run in your web browser for 2D, 3D, and higher-dimensional scientific data, including point clouds acquired as LiDAR data, surface models that represent molecular structures, and AR/VR environments that incorporate volume renderings of medical images. It is freely available as open-source software for academic and commercial use. As an implementation of the Visualization Toolkit (VTK) in an ES6 JavaScript library, it also leverages WebGL, WebGPU, and WebXR to support a wide variety of visualization algorithms and data structures.
For this v26 release, we have developed a ton of cool new features to further power-up your web-based visualizations. These features build upon the many capabilities added during our previous VTK.js release and provide a wide range of new capabilities.
Features
Below lists some of the notable changes that landed in v26.
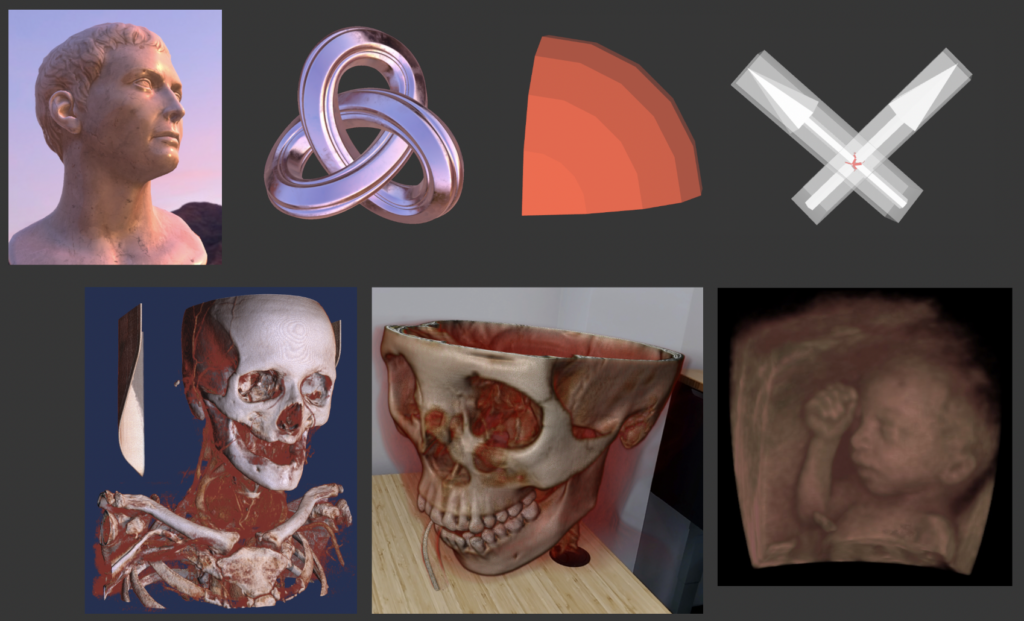
- Cinematic Volume Rendering (release blog post)
- WebGPU: environment mapping and PBR (release blog post)
- Clip closed surface (live example)
- OBB Tree with collision detection (live example)
- 16-bit normalized 3D texture support (thanks to @sedghi!)
- Radon transform blending mode (live example)
- Edge hardware picking (live example)
- vtkSphereWidget (live example)
Breaking Changes
If you’re looking to upgrade to v26, be aware that there are a few breaking changes from v25. You can see a list of those changes in our breaking changes document.
- SVG Widgets have been fully removed. All SVG examples have been migrated to use an SVG helper.
- ResliceCursorWidget’s API has been updated. Please refer to its documentation and usage for more information.
- Mix-in aware glyph widget
Learning more about VTK.js
If you want to learn more about vtk.js or get help, we have you covered. Below is a list of links to help you navigate vtk.js and its help forums.
If you would like to complement vtk.js’s visualization with analysis or pre-processing of your data, consider itk-wasm. itk-wasm provides simple, efficient support for spatial processing pipelines in WebAssembly. Data can be transferred with the vtk.js ITKHelper.
If you are looking for a server side solution to perform data processing and visualization consider using trame. Trame lets you create your application in plain Python which can then leverage VTK/ParaView with vtk.js. If you want to learn more and explore dozens of examples, go to trame website.
Want to see VTK.js used in a medical viewer? Check out VolView, a drag-and-drop DICOM viewer for the web! Features include cinematic volume rendering, DICOM reading without any external server setup, annotations, and much more.
- For general info, visit the vtk.js website.
- To browse the source code, visit our Github repo.
- Found a bug? Have a feature request? Drop them in our issue tracker.
- To ask questions on how to integrate vtk.js into your projects, stop by the VTK Discourse web section.
- You can find a complete list of vtk.js examples on our example page.
- For an example application built using vtk.js, check out ParaView Glance.
- We provide regular (or on demand) VTK.js day long remote training.
- Trame general information available on website
Funding and Acknowledgements
We would like to thank all of the external contributors who helped improve vtk.js. Here is the list of contributors since the last vtk.js release post.
We would also like to acknowledge the funding sources that have helped contribute to vtk.js:
- NIH R01EB014955, R42NS086295, R01EB028283, and R01EB021396