Why are my builds slow? Using CMake’s Instrumentation Feature

Summary
- Overview
- What is CMake Instrumentation?
- What’s New with CMake Instrumentation?
- Writing Callbacks for CMake Instrumentation
- A Practical Exercise: Why are my builds slow?
Resources
Overview
CMake 4.2 dropped the experimental gate on a major new feature: the CMake Instrumentation API. This enables detailed tracking of the entire CMake workflow, including configure time, build execution, testing, and installation, and provides developers and teams with actionable insights into build performance. Support for automated, user-written scripts to handle instrumentation data make it easy to track performance data over time across different machines and environments.
This post covers an explanation of the feature, a summary of what’s new since the last post about CMake Instrumentation, and some practical guidance for how to use CMake instrumentation to diagnose build time inefficiencies in your own projects.
What is CMake Instrumentation?
At a high level, CMake Instrumentation allows you to collect detailed metrics about every step of your CMake workflow. This turns opaque build or test times into actionable results, enabling users to find bottlenecks and inefficiencies, develop real performance improvements, or make data-driven decisions about how and when to run their build or tests.
Without CMake instrumentation, your build output might look something like this:
myproject/build $ cmake ..
-- Configuring done (30.2s)
-- Generatingdone (5.2s)
myproject/build $ ninja
[3041/3041] Linking CXX static library project/libproject.a
myproject/build $
Configure and generate give us some high level timing information, but there is very little to work with. Even if we timed the build command, we’d have no visibility into where that time was going. Using CMake instrumentation, you could write a callback to print out additional details after each build, customized to your liking:
=== CMake build instrumentation summary ===
---------------------------------------------
Build elapsed: 184.732 s
Role          Commands     Time (s)   Peak RSS (MiB)
----------------------------------------------------
compile           2860     1248.615           1842.7
link               121       38.924            612.3
custom              60       26.481            128.6
Total command time: 1314.020 s; failed commands: 0

Top 3 targets by time:
---------------------------------------------
Target                    Commands     Time (s)
-----------------------------------------------
project                        842      386.214
geometry                       516      241.873
rendering                      438      207.562

Top 3 commands by memory:
---------------------------------------------
Peak RSS (MiB)     Time (s)  Command
--------------------------------------
1842.7             8.614     compile: project
                             source: project/src/Registry.cpp
1624.3             7.283     compile: geometry
                             source: geometry/src/MeshOperations.cpp
1496.8             6.941     compile: rendering
                             source: rendering/src/Render.cpp

Trace: /path/to/myproject/build/instrumentation/traces/postBuild-3044-2026-10-09T14-20-00-0123.json
Or, generate Google Trace Event format files to visualize your build at a much more granular level:
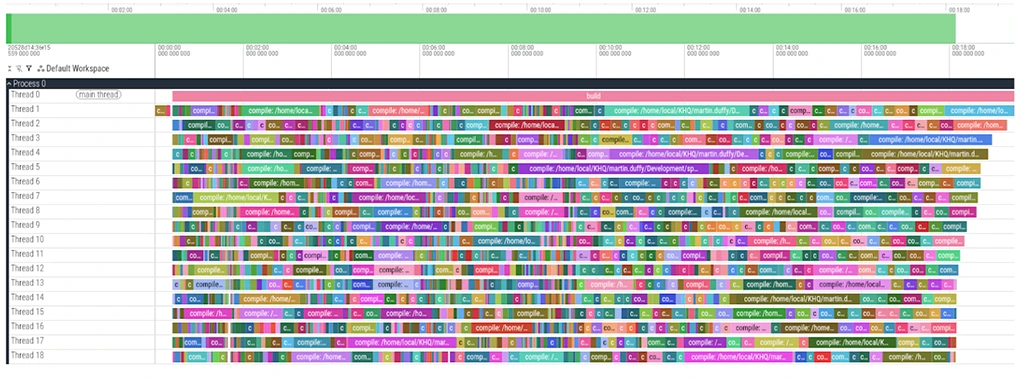
Furthermore, because user callbacks run automatically, you could easily submit the data from every build to a database, and track changes in performance over time across different machines or environments.
CMake instrumentation works by wrapping every compile, link, custom command, and test invocation in a launcher that collects various metrics about runtime and resource usage. These metrics get written to a JSON file called a “snippet”. A single snippet file is generated for every compile, link, and test invocation, as well as for the overall configure, generate, build and test phases. Over the course of a CMake workflow, these snippet files will accumulate in the project build tree until indexing occurs. Indexing can be run manually with ctest --collect-instrumentation, or automatically at configured intervals, such as after each build. This process gathers up all these snippet files and generates a top-level “index” JSON file. The index is then passed off as an argument to any user-written callbacks as an entry-point to the data, after which CMake cleans up the snippet files, preventing infinite accumulation. Some advice on writing instrumentation callbacks is included later in this post.
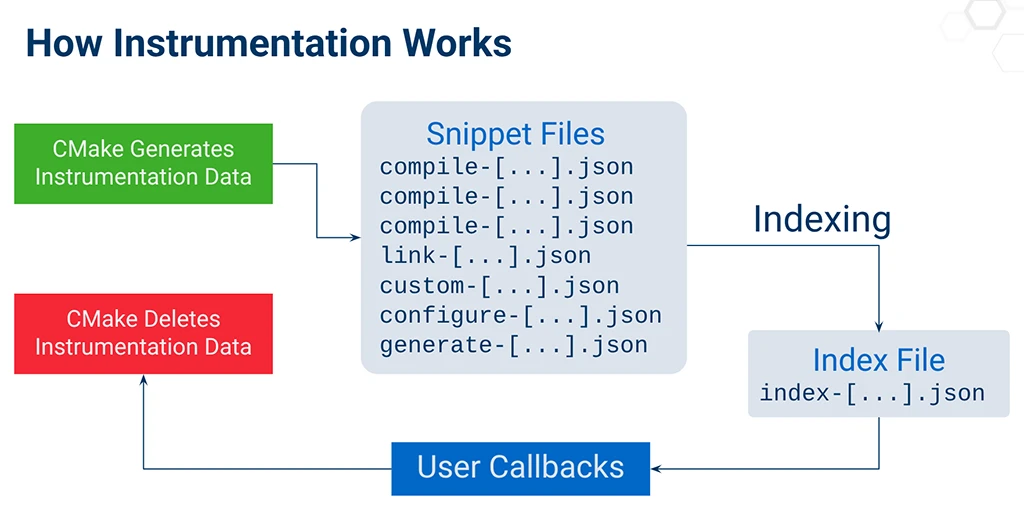
Enabling CMake instrumentation can be done at the “user-level” by placing a JSON query in the user’s CMAKE_CONFIG_DIR to run on all CMake projects. Alternatively, project-specific queries like the one below can be configured by using the cmake_instrumentation() command in the project’s CMakeList.txt.
cmake_instrumentation(
  API_VERSION 1
  DATA_VERSION 1
  OPTIONS
    staticSystemInformation  # collect static system data
    dynamicSystemInformation # collect dynamic system data
    trace                    # generate a Google Trace Event file
    cdashSubmit              # submit data to CDash
    captureOutput            # include stdOut and stdErr in data
    compiileTrace            # collate compiler generated traces
    processMetrics           # collect maxRSS, userTime and systemTime
  HOOKS postGenerate postBuild postCTest
     # when to index data and run CALLBACK
  CALLBACK "${CMAKE_COMMAND}" -P /path/to/handle_data.cmake
     # index file will be appended to args
)
Here’s a summary of what commands are instrumented, and what are our available hooks for running a custom instrumentation callback.
Instrumented Commands
configure: the CMake configure stepgenerate: the CMake generate stepcompile: an individual compile step invoked during the buildlink: an individual link step invoked during the buildcustom: an individual custom command invoked during the buildbuild: a completemakeorninjainvocation (not throughcmake --build).cmakeBuild: a completecmake --buildinvocationcmakeInstall: a completecmake --installinvocationinstall: an individualcmake -P cmake_install.cmakeinvocationctest: a completectestcommand invocationtest: a single test executed byctest
Instrumentation Hooks
postGeneratepreBuild(called whenninjaormakeis invoked)postBuild(called whenninjaormakecompletes)preCMakeBuild(called whencmake --buildis invoked)postCMakeBuild(called whencmake --buildcompletes)postCMakeInstallpostCMakeWorkflowpostCTest
See the documentation for the full use case and available options.
What’s new with CMake Instrumentation?
CMake 4.4 and the upcoming CMake 4.5 release introduce several big features for instrumentation. See the Data Version documentation for details about which features are available in which versions of CMake. You can also parse the output of cmake -E capabilities to see which CMake instrumentation data versions your CMake supports.
The newest features include the following options:
trace: automatically generate a Google Trace Event format file when indexing occurs, for easy visualizationcaptureOutput: enable reporting stdOut and stdErr of each commandcompileTrace: capture any compiler trace files generated by clang’s -ftime-trace flag, and link them to the associated compile data in the outputprocessMetrics: capture maxRSS, userTime and systemTime for each command
These additional metrics provide further insight into a complete CMake workflow. Metrics such as the complete compiler trace and memory usage per-command allow users to identify why certain segments take as long as they do with greater precision, and to track more complex performance regressions beyond the total duration.
There’s also been updates to how instrumentation data is viewable in CDash, including the ability to visualize instrumentation data for tests, and to see a heat map of memory usage for each instrumented command.
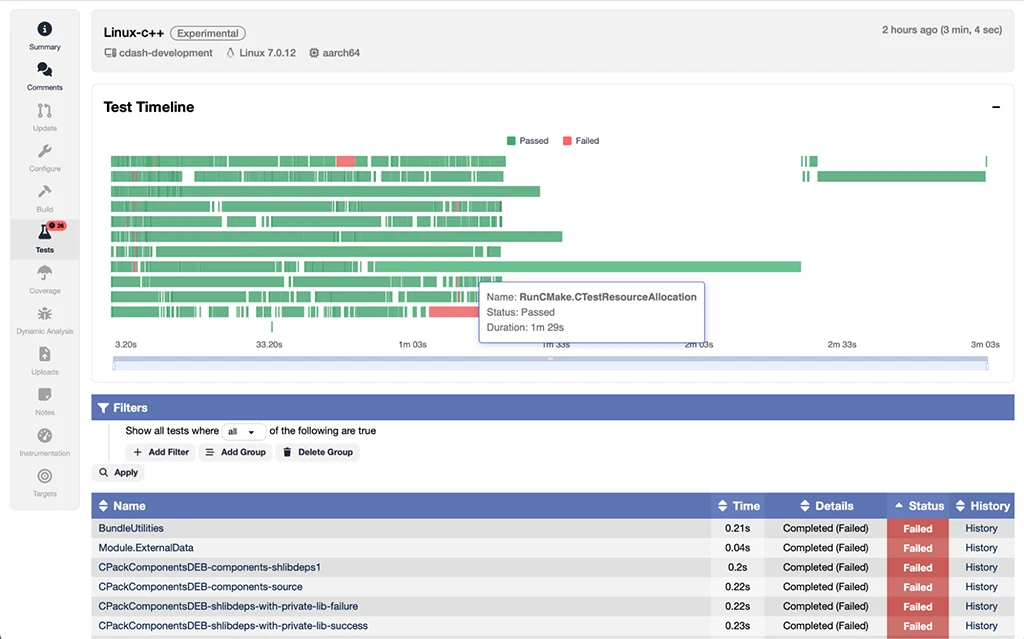
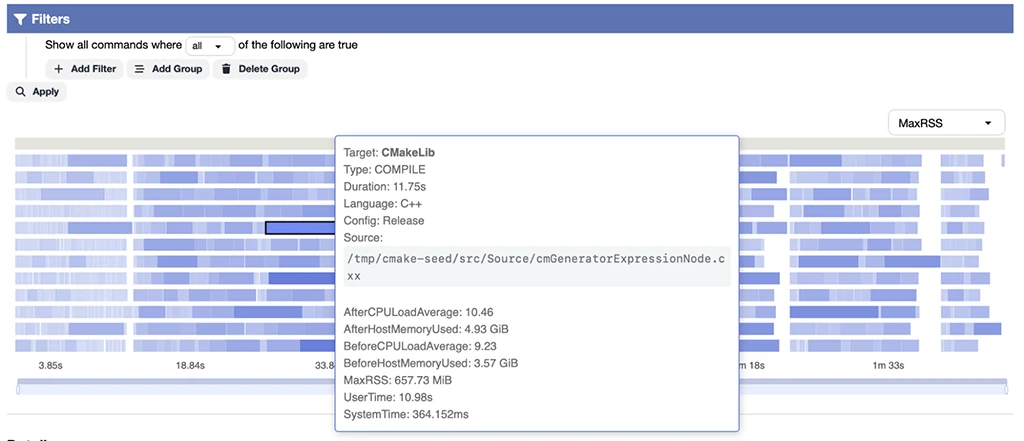
CMake’s nightly CI includes a build with instrumentation. You can find the latest runs here for an interactive example. After selecting a recent build, find Instrumentation in the sidebar to visualize it.
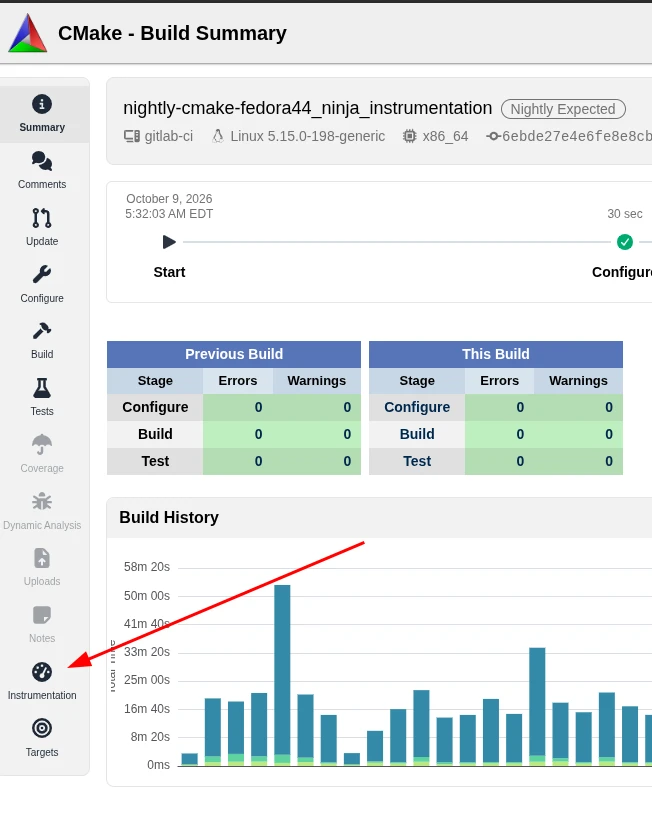
You can also check out the original blog post about CDash integration with CMake instrumentation for more detail.
Writing Callbacks for CMake Instrumentation
Writing custom callback scripts is required because the consumption of instrumentation data will be specific to the needs of the project or user. These scripts are called whenever indexing occurs, passing an index JSON file as an argument to serve as an entry-point to the collected data. Once all user callbacks have been executed, CMake removes the generated snippet files, so it’s up to the callback to preserve any data, by storing it elsewhere or submitting to a database.
When writing an instrumentation callback, it’s best to consult the documentation for the index file contents. Be sure to reference the documentation for your current CMake version. Here’s a small, example callback that simply copies the instrumentation data to a separate directory:
import json
import os
import shutil
import sys

if name == "main":
    # The instrumentation feature will pass the path to an index file to this callback
    index = sys.argv[1]

    # Get the buildDir and dataDir from the index file
    with open(index) as f:
        data = json.load(f)
        buildDir = data["buildDir"]
        dataDir = data["dataDir"]

    # Get a unique output directory name based on the index filename
    indexName = os.path.basename(index).split(".")[0]

    # Create an output directory that CMake won't clear, to copy the files into
    outputDir = os.path.join(buildDir, "instrumentation")
    indexDir = os.path.join(outputDir, indexName)
    for d in [outputDir, indexDir]:
        if not os.path.exists(d):
            os.makedirs(d)

    # Copy all the instrumentation data into the newly created output directory
    for snippet in data["snippets"]:
        shutil.copyfile(
            os.path.join(dataDir, snippet),
            os.path.join(indexDir, snippet)
        )
    shutil.copyfile(
        index,
        os.path.join(indexDir, os.path.basename(index))
    )
You can find a more complicated example callback here. The example prints out various instrumentation metrics after each build, install, and ctest invocation.
The following code-snippet could be inserted into a CMakeLists.txt to enable this callback.
cmake_instrumentation(
  API_VERSION 1
  DATA_VERSION 1.2
  OPTIONS processMetrics trace
  HOOKS postCMakeBuild postBuild postCMakeInstall postCTest
  CALLBACK "${Python3_EXECUTABLE}" /path/to/summary.py
)
If you want to enable this callback for every CMake project run by your user, you could instead place a JSON query under $CMAKE_CONFIG_DIR/instrumentation/v1/query
{
  "version": { "major": 1, "minor": 2 },
  "options": [ "processMetrics", "trace" ],
  "hooks":  "postCMakeBuild", "postBuild", "postCMakeInstall", "postCTest" ],
  "callbacks": ["/path/to/python3 /path/to/summary.py"]
}
Earlier in this blog, we showed the output of this example callback running in a post CMake build context. We can also expect some output summarizing an invocation of ctest.
=== CTest memory diagnostics ===
--------------------------------------------------------
  Peak RSS (MiB)     Time (s)     Result  Test
----------------------------------------------
           206.6        0.107     passed  memory.192MiB
            78.5        0.053     passed  memory.64MiB
            30.6        0.035     passed  memory.16MiB
            19.5        0.236     passed  cpu.500000
            19.2        0.018     passed  app.smoke
            19.2        1.755     passed  cpu.4000000

Trace: /path/to/instrumentation/traces/postCTest-7-2026-10-09T13-45-59-0657.json
In general, instrumentation callbacks can be configured to run after each cmake --build invocation (postCMakeBuild), or after each invocation of the build tool: make, ninja or fbuild (postBuild). However, note that the postBuild hook runs as a background process, and the output from our callback will not be printed to the command-line in this case.
A Practical Exercise: Why are my builds slow?
Thanks for reading this far! To finish, here’s a walkthrough example to demonstrate how CMake instrumentation can help you make informed decisions about your build performance, and point out some common ways CMake projects might suffer from reduced parallelism.
For this exercise, an application links two groups of libraries:
- A series of “stage” libraries, that each link to a “config” library. The config library has a private header that gets generated at build time.
- A chain of “compute” and “schema” libraries with generated source files, that depend on one another.
1. Establish a baseline
To establish a baseline, I’ll run a clean CMake build with a fixed parallelism. The instrumentation callback from earlier is enabled, and I’m generating a Google Trace Event file that will be used to visualize the build.
cmake -S . -B build -G Ninja
cmake --build build-original --clean-first --parallel 6
Because I enabled the example instrumentation callback linked above, this will immediately print the output of that report.
=== CMake build instrumentation summary ===
-------------------------------------------
Build elapsed: 12.217 s

Role         Commands     Time (s)   Peak RSS (MiB)
----------------------------------------------------
compile      22           28.610     234.4
link         64           1.970      194.0
custom       9            7.137      20.2
Total command time: 37.717 s; failed commands: 0

Top 4 targets by time:
----------------------------------------------------
Target                    Commands     Time (s)
-----------------------------------------------
stage_1                          4        4.941
stage_3                          4        4.854
stage_2                          4        4.815
stage_0                          4        4.812

Top 4 commands by memory:
---------------------------------------------------
  Peak RSS (MiB)     Time (s)  Command
--------------------------------------
           234.4        4.718  compile: stage_2
           234.2        4.761  compile: stage_3
           233.7        4.720  compile: stage_0
           233.6        4.850  compile: stage_1

Trace: /path/to/build/instrumentation/traces/postCMakeBuild...json
This tells us the build took just over 12 seconds, and gives an overview of the slowest commands, but it doesn’t give the full picture. Opening the generated Google Trace Event file will show us more. You can open these files in Perfetto UI, or any other compatible viewer.

It’s clear from this visualization that the 6 threads we gave our build are not being fully utilized.
2. Define the visibility of our generated files
One thing that might stick out is the generation of config.hpp, a private header file, which is slow, and bottlenecking the rest of our build.
The generated header is initially attached like this:
add_library(config STATIC config.cpp)
target_sources(config PRIVATE "${generated_dir}/config.hpp")
target_include_directories(config PRIVATE "${generated_dir}")

add_library(stage_0 STATIC stage_0.cpp)
target_link_libraries(stage_0 PRIVATE config)

add_custom_command(
  OUTPUT "${generated_dir}/config.hpp"
  COMMAND …
)
Although we specified the generated source file as PRIVATE, CMake creates an extra dependency here. In case any of our consuming targets end up needing access to this source file, we wait for its generation before beginning to compile them. This is why we can see the compilation of “stage_0”, “stage_1”, “stage_2”, and “stage_3” waiting for the generation to finish before starting.
In this case, however, the generated file is a private implementation detail. If we define it as such, using FILE_SETs, our dependent targets will be able to start compiling much sooner.
target_sources(config PRIVATE
  FILE_SET implementation_headers TYPE HEADERS
  BASE_DIRS "${generated_dir}"
  FILES "${generated_dir}/config.hpp"
)
After running a clean build and opening the generated trace file, we can see the impact this had on our build parallelism:

Now we can compile these sources in parallel with the code generation, and our overall build time is reduced.
3. Optimize Static Library Dependencies
There’s still another bottleneck in our trace. Looking at the “compute_*” targets, we can see a repeated sequence of code generation, compilation, and linking. This leaves much of the build running one stage at a time.
Here’s a simplified piece of that dependency chain:
add_custom_command(
  OUTPUT "${generated_dir}/schema_1.cpp"
  COMMAND …
  DEPENDS "${schema_input}"
  VERBATIM
)

add_library(schema_1 STATIC "${generated_dir}/schema_1.cpp")
target_link_libraries(schema_1 PRIVATE compute_0)

add_library(compute_1 STATIC compute_1.cpp)
target_link_libraries(compute_1 PRIVATE schema_1 compute_0)
By default, when a static library links to another target through target_link_libraries(), CMake adds build-order dependencies on that target, even though creating the static archive does not require the linked library to be built. Those ordering constraints can also cause custom commands that generate sources for the library to wait for upstream targets. CMake does this conservatively because an upstream target might produce headers or other files needed by downstream work. Enabling the OPTIMIZE_DEPENDENCIES option examines the dependencies of static and object libraries and removes unnecessary build-order constraints, while retaining explicit ordering and dependencies associated with code generation or other relevant side effects. The final executable still waits for the libraries it needs to link, but independent generation and compilation can start sooner.
set(CMAKE_OPTIMIZE_DEPENDENCIES ON)This initializes the OPTIMIZE_DEPENDENCIES property on new targets. If we wanted to apply it to just one existing target, we could instead use:
set_property(TARGET schema_1 PROPERTY OPTIMIZE_DEPENDENCIES ON)After another clean build, we can see the difference:
The schema generators can now run without waiting for the preceding compute archives. We can see generation advancing through the chain while the compute sources compile in parallel. The final application still waits for all of its required libraries before linking.

4. Lessons Learned
A slow build isn’t always caused by long running compilations or links. Sometimes the problem is the time spent waiting for work that isn’t actually needed yet. Visualizing the parallelism of our build makes it easy to see those waits, and validate our performance improvements. Specifying the visibility of our generated files, and using less conservative build edges with OPTIMIZE_DEPENDENCIES, can be a few easy ways to gain significant speed up to our build.
In order to dig deeper into the performance of individual commands, instrumentation supports the collation of generated compiler trace files. You can read more about understanding those files here.
If you wanted to take a closer look at where CMake configure time is going, you can generate a Google Trace event file for the configure and generate stages as well, without needing to use CMake instrumentation. See the –profiling-output and –profiling-format options when running CMake.