Look Up Geoscience uses ParaView to improve subsurface visualization
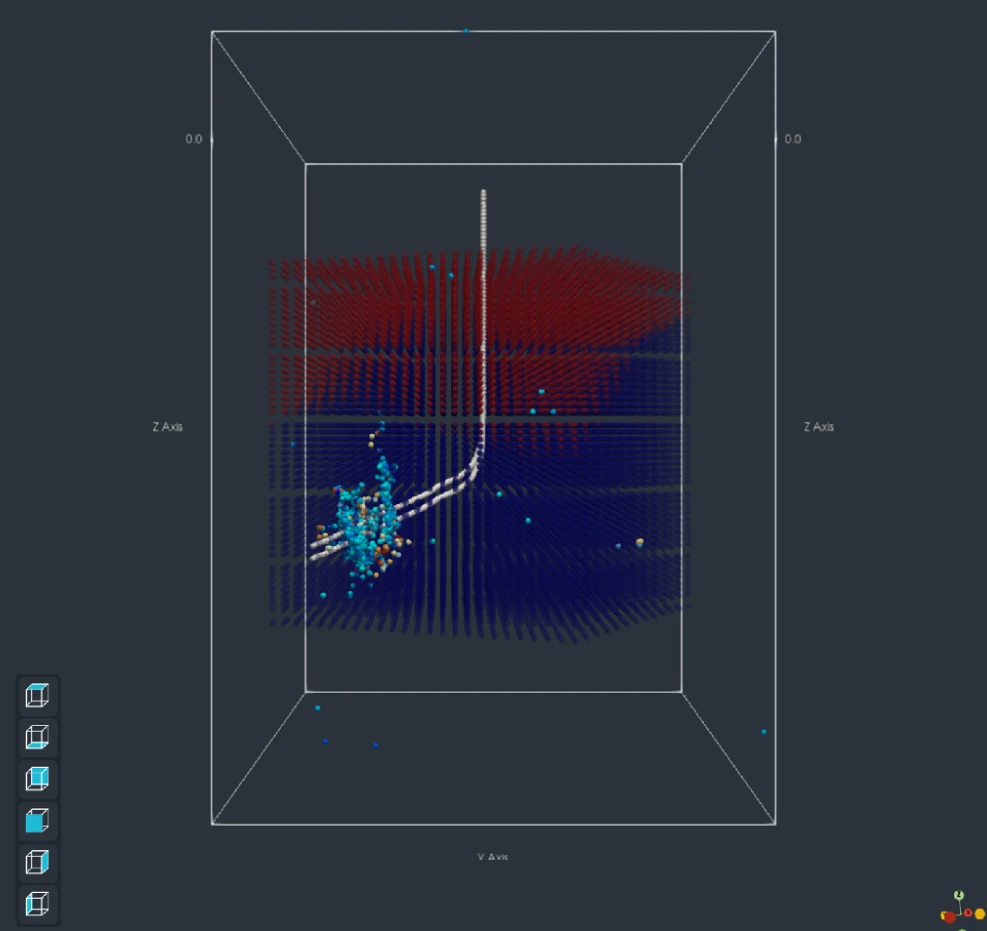
This is a guest blog post from Nicolas Cami and Florian Carnac from Look up Geoscience. They share their recent work using ParaView as a framework for EarthSight™ software. Thanks to their innovative approach using QML in ParaView, they created a nice-looking application to help with subsurface modeling, simulation, and visualization.
Subsurface modeling software has long been confined to fossil fuel and mining exploration, leaving a critical gap: the lack of accessible tools for downloading, visualizing, and rapidly interpreting heterogeneous data to mitigate risks in low-carbon energy projects. In response, at Look up Geoscience, we are developing an intuitive, user-friendly software solution to accelerate the exploration of sustainable energy sources like geothermal and natural hydrogen. It is in this context of energy transition that we have formed a partnership with Kitware.
This collaboration leverages the power of VTK and ParaView, two open source platforms renowned for their advanced capabilities in scientific data processing and visualization.
The choice of ParaView as a platform was motivated by many existing capabilities: the ability to load and visualize in 3D numerous scientific data formats (SEG-Y, LAS, CSV, VTK…), a client/server architecture, integration of a Python interpreter, and a plugin system. Thus, we built the first desktop version of EarthSight™ as a ParaView-based application. Still, there were numerous challenges to overcome because of Look Up Geoscience’s mission: to simplify complexity and make subsurface knowledge accessible and intuitive, enabling geoscientists to mitigate risks in their projects. This imperative required a revamp of the graphical user interface (GUI) and the integration of geoscience-specific features into ParaView:
- Georeferencing: being able to display and work with data that don’t share the same world coordinate reference system.
- Reading numerous geoscience-specific file formats.
- Project and knowledge management tailored to geoscience workflows.
- Specific viewers like a cartographic view and a well log view.
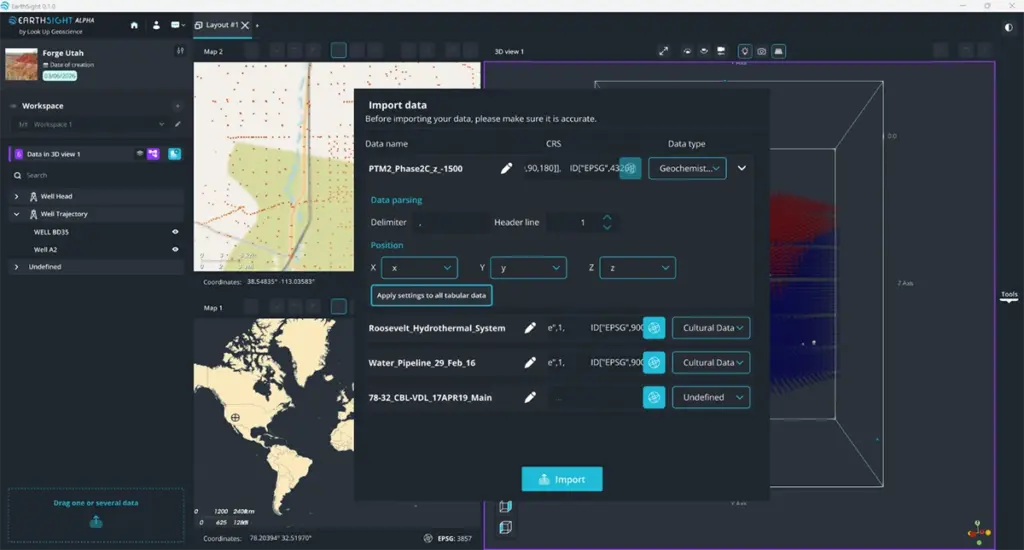
Leveraging QML for a modern, intuitive interface
The user interface (UI) and user experience (UX) aspects are central to our project, which develops a platform used daily by geoscientists. ParaView’s GUI relies on QtWidgets. After a few weeks of struggling with Qt Style Sheet (QSS) to achieve the desired design, we decided to try using QML instead. First sparingly, then progressively, almost the entire GUI.
Using QML allows us to finely control the graphical components of our client. The recent migration of ParaView to Qt6 was a fortunate coincidence for our application, as the advancements in QML in this version are significant. The integration of QML code in VTK and ParaView is done using QQuickWidget, which allows us to implement our own UI while keeping some ParaView widgets when they suit us.
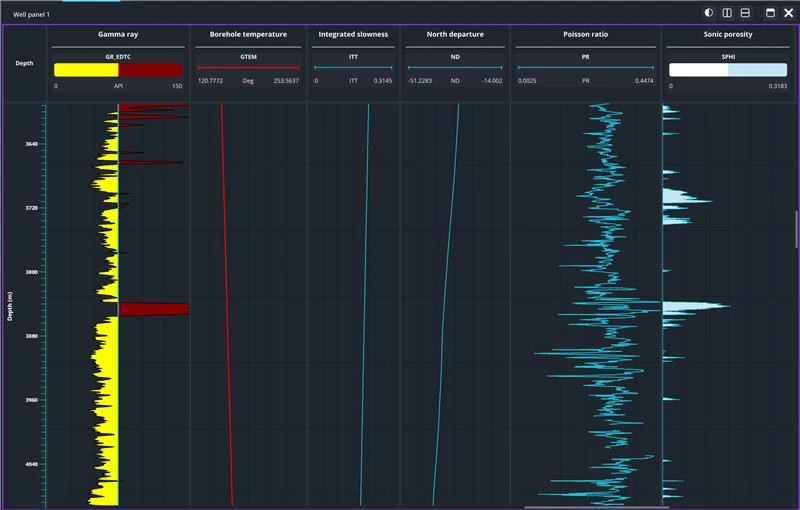
A typical use case for QML that we have is visualizing well logs, implemented in a new viewer. This viewer respects the ParaView client/server architecture, and on the client side, QML handles the rendering.
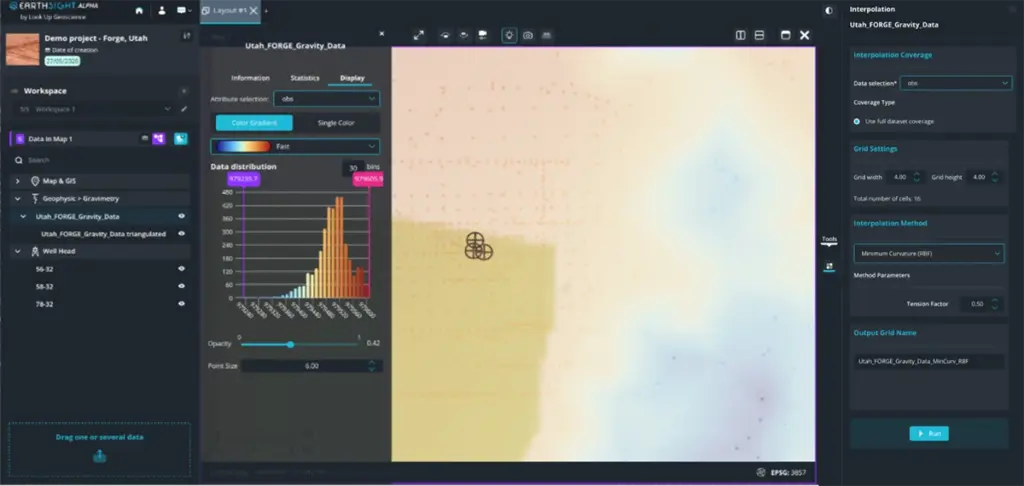
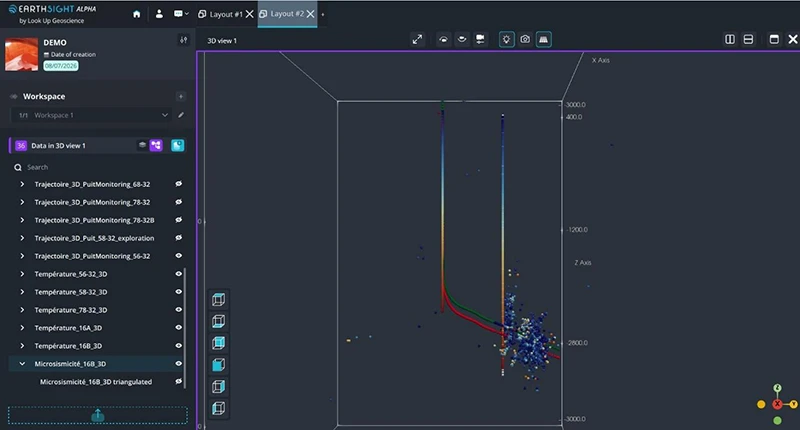
You can see in the screenshot below a glimpse of our ParaView-based application’s workspace. Here, everything is QtQuick, except for the pqTabbedMultiViewWidget in the central area, which we customized with that good old QSS.
Streamlining workflows for geoscientists
As mentioned above, one of our main challenges is simplifying the application and its workflows. That is why in EarthSight™, the pipeline browser is replaced by this left-hand panel, which we call the “gallery”. Through this gallery, users can control the ParaView pipeline without any knowledge of VTK or ParaView. Behind the scenes, EarthSight™ creates the appropriate readers and filters and manages them transparently for the user.
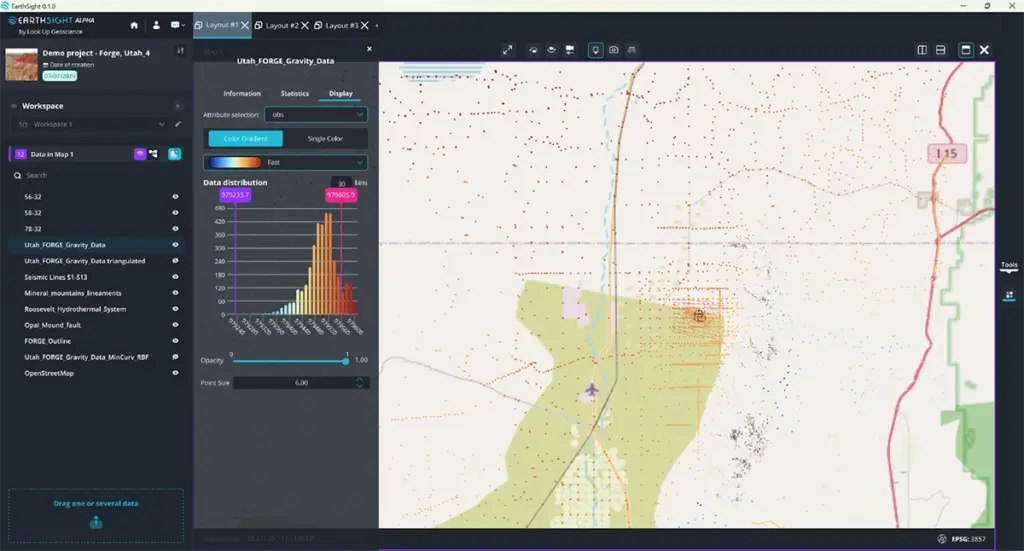
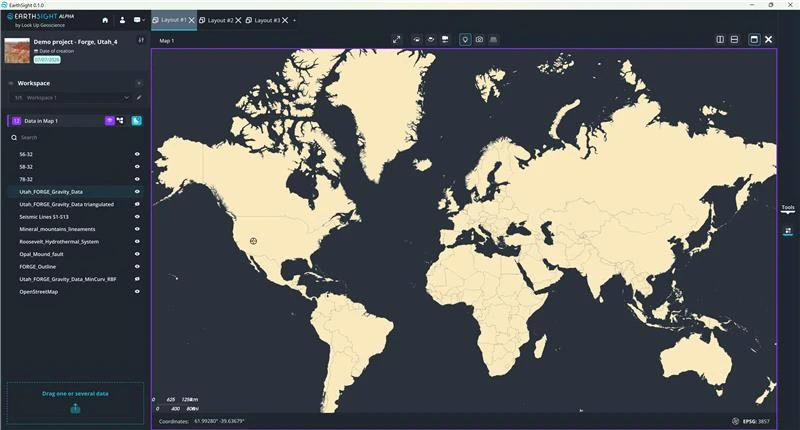
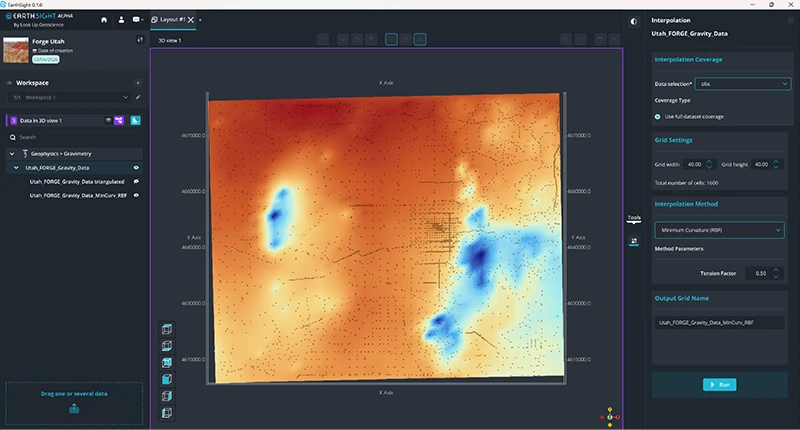
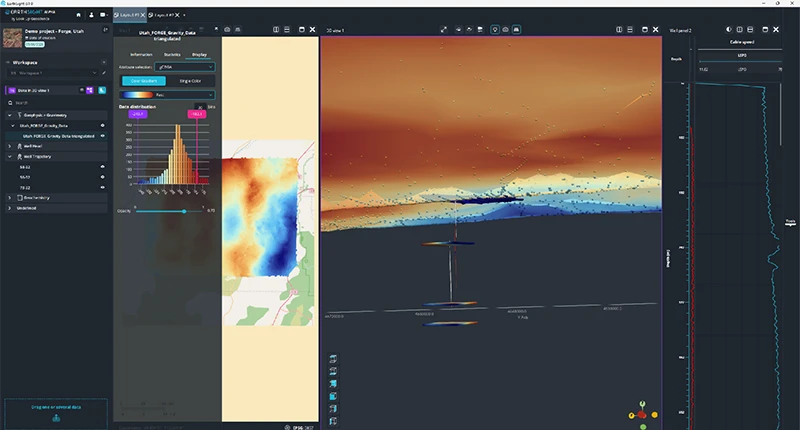
Shown below are several screenshots of the application, highlighting its dedicated 2D and 3D views, illustrating the typical workflow of geoscientists:
A Complementary Vision for Subsurface Modeling
The interface proposed by Look Up Geoscience is a different approach, dedicated to geoscientists’ needs, made possible by the specific approach of our project with QML in ParaView. Beyond the richness of ParaView’s capabilities, we aim to simplify its use and complement it with tools tailored for geosciences.
Through this partnership and continuous evolution of EarthSight™, Look Up Geoscience and Kitware are not only addressing the needs of today’s geoscientists but also paving the way for a more accessible, intuitive, and sustainable future in subsurface modeling.
Join the Lookup Up Geoscience user community and try the alpha version of EarthSight™.
Looking to take your application to new heights? Contact Kitware’s team of experts for development and support services, and fast-track your success with ParaView.