VERACore: trame in Application

In the first posts of this blog series we provided a high-level overview of trame: a Python- and web-based framework for visual analytics[1,2]. In this post we further illustrate some key concepts of trame through a real-world example. Due to the generosity of the DOE’s Nuclear Energy Advanced Modeling and Simulation (NEAMS) program, a complete working application is available to those that wish to learn more about trame. This important NEAMS research program, known as VERA, is used to solve neutronics, thermal-hydraulics, fuel performance, and coupled physics problems for light-water nuclear reactors (LWRs). It integrates physics components based on science-based models and state-of-the-art numerical methods[3,4].
Kitware’s role in this work was to rewrite VERA’s interactive visualization application, VERAView, used to analyze output data from VERA. VERAView was initially a desktop application developed over a period of approximately seven years. The trame-based replacement, known as VERACore, was recently created in approximately 2.5 weeks of developer effort (admittedly, very skilled Kitware developers) with 3,000 lines of code (LOC) with trame. (For comparison, VERAView is over 30,000 LOC.) Of course, this is not a fair comparison since the desktop VERAView application required envisioning capabilities, designing an effective user interface and workflows, and integrating visualization and other analysis features from VERA. Further, the VERACore trame-based application leverages the powerful capabilities of VTK/ParaView, Vue.js/Vuetify, and several Python libraries. However, the breathtaking speed to develop, and the brevity of this and other trame-based applications, is consistent with the productivity gains we have seen thus far with trame.
Re-implementing VERAView with trame also added several significant features.
- Firstly, the new VERACore application is web-based: it is easy to deploy through any standard web browser. (To run VERACore, and interact with the application, simply point your browser to: https://pvw.kitware.com/vera/ and you will see something like Figure 1 below.) There is no need to download operating-specific binaries, nor be concerned with security risks related to installing software on a computer.
- VERACore is built on trame’s client-server architecture which can scale to meet data and computational demands. In larger-scale applications, it’s possible to separate heavy computing and even rendering to a remote server, sending results to the web client. This is particularly important when data becomes prohibitively large and copying data to the desktop is not possible – the server can be deployed alongside the data system. Note however that the client and server can be bundled and used as a standalone desktop application–in this case from the user’s point of view the client-server architecture totally disappears.
- Thirdly, trame-based applications can leverage JavaScript especially Vue.js and the Vuetify UI framework. As illustrated by Figure 1, the UI is polished, highly interactive, and customizable – consistent with a modern, well-designed user interface.
- And finally, trame leverages Python libraries: in VERACore, some notable libraries include Plotly, NumPy, and H5py. Of course the Python interface to the visualization and data analysis libraries VTK and ParaView are integrated into trame as well, providing a wealth of visual analytics capabilities.
In the following post, we will walk you through the trame-based VERACore application and highlight several implementation features. For those of you who cannot wait or want to dive into the details of the source code, please visit this github site.
Application Overview
The figure below shows VERACore in action–small variations in appearance are possible depending on the browser and any special settings.
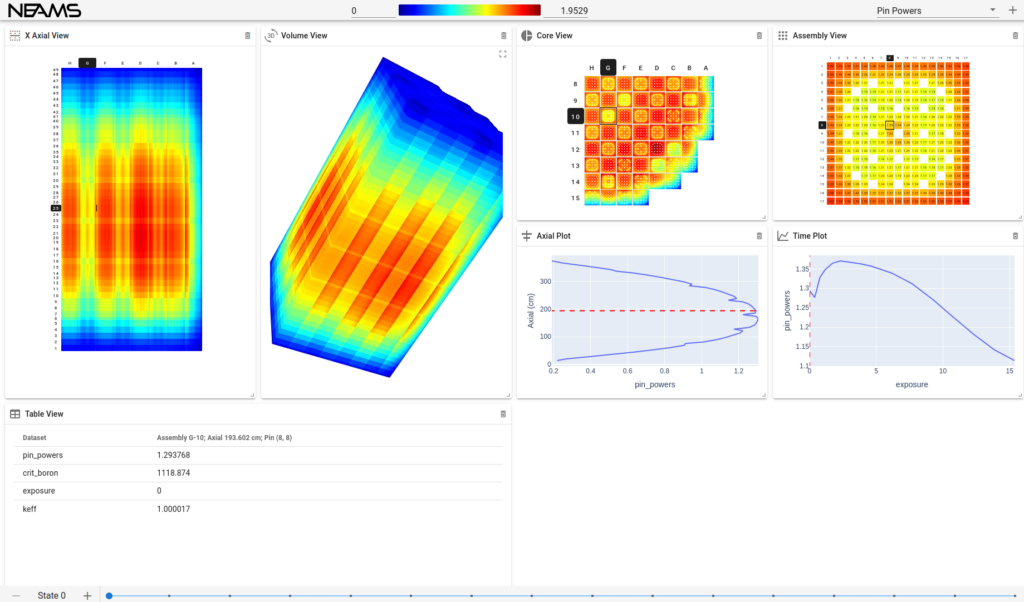
The application consists of several different “Views” of the underlying temporal data, x-y plots of selected data, a timeline indicating current the time step (in the footer of the application), and a horizontal scalar bar and scalar field selection in the header of the application. All views, plots, and other UI elements are cross-linked, so that making changes will automatically update the appropriate UI elements. (Note that progress is indicated after scalar selection by a spinning cursor – a nice UI touch!) The application supports plots, 2D views, and 3D interactive views. For example, the X Axial View shows a 2D reactor core visualization, while the Volume View provides a 3D interactive visualization.
Trame Implementation
In the following we highlight several selected application features. While certainly not an exhaustive description, hopefully it will clarify some implementation details.
Overall Framework
To begin with, VERA produces output in the form of an HDF5 file. A class named VeraOutFile was created as an interface for ingesting this data. Some static information about the reactor core is obtained from this file, including the layout of the core, number of layers, and so on. Output arrays for each time step are also provided by this file. The VeraOutFile class is also responsible for tracking which time step in VERACore is currently active, and it loads all of the data from that time step into memory for faster data access when updating the views. Because trame is written in Python, we are able to leverage excellent tools from the scientific community such as h5py.
On the UI side, vera_core/app/ui/__init__.py is responsible for creating the general layout of the program, including the toolbar at the top, the grid layout in the middle, and the time step slider at the bottom. Each item in the grid layout is then defined in its own Python file, which includes the grid item’s layout, initial values, as well as an update function that is called when the grid item needs to be updated. For example, the file vera_core/app/ui/volume_view.py defines the Volume View.
One of the powerful features of trame is that it can be used in conjunction with JavaScript. This enables developers to leverage Vue.js and Vuetify to create compelling interfaces. In VERACore, some simple, custom JavaScript components were written and used within some of the views. For example, the CoreView JavaScript component is responsible for drawing the core view, indicating which assembly is currently selected, and changing the selected assembly on mouse click.
The plots were created by using Plotly, the table was created using VDataTable (accessible from the trame-vuetify package), and the 3D volume view was created using VTK.
Much of the power and simplicity of trame comes from its intuitive reactive programming style in which pieces of an application are described in isolation. Developers only need to focus on the part of the state that is needed, and/or link to any events that affect the isolated code. The code examples in the following demonstrate these programming patterns.
Creating and linking views and plots
The views (including plots) are defined in their own Python files. These files have two main sections: a UI section that defines the layout of the view, and an update section that indicates how and when the view is to be updated. For example, the layout of the axial plot is defined as follows:
with DivLayout(server, template_name="axial_plot") as layout:
    layout.root.style = "height: 100%; width: 100%;"

    figure = trame_plotly.Figure(
        display_logo=False,
        display_mode_bar=False,
        style="height: 100%; width: 100%; user-select: none;",
    )
    ctrl.update_axial_plot = figure.update
The update function (see the Updating views section below) then takes the data, generates the figure using Plotly, and then updates the UI figure via ctrl.update_axial_plot(new_fig).
All of the views and plots are then linked primarily through trame state variables, and sometimes through controller functions.
Managing the scalar bar and timeline
The range of the scalar data as indicated by the color bar in the application header is automatically set based upon the range of the currently selected scalar array. When the selected array changes, the color range is reset to the new range of the selected array. The colors in the views are then generated by passing the values through a lookup table to determine their color.
The timeline is a VSlider that is accessible via trame-vuetify. It is connected to the state variable selected_time. When the selected time changes, this triggers the VeraOutFile object to change the active state to the one at the selected time, and then it calls the controller function on_vera_out_active_state_index_changed(), which triggers the needed views to update (see Updating views below).
Updating views
In trame, Python decorators[5] are typically used to register callbacks for certain events, such as a change in a state variable or a call to a controller function.
In VERACore, these decorators are used to trigger updates for each view. Let’s take a look at the Core View, for example. The default Core View is displayed below.
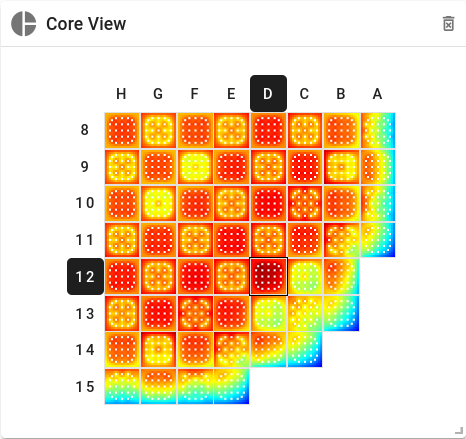
The decorators to update the Core View are:
@state.change("selected_array", "selected_layer")
@ctrl.add("on_vera_out_active_state_index_changed")
def update_core_view(selected_array, selected_layer, **kwargs):
      …
If there is a change to the selected_array state variable (which is the active scalar name such as “Pin Powers”, “Pin Clad Temps”, etc.) or the selected_layer (which is the index in the axial layer), or the controller function on_vera_out_active_state_index_changed() is called (which happens after a change in the time step), then the view needs to be updated, and the update_core_view() function will be called.
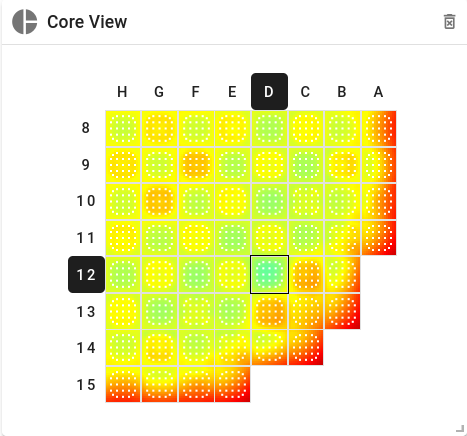
So, for instance, if the selected array is changed to “Pin Moderator Density”, this function will be called, and the core view is updated to appear as the following:
Summary
We have found trame to be an amazingly productive environment for creating visual analytics applications. VERACore is a wonderful example: we were able to reproduce an application that initially took years to design and develop in a matter of weeks. In addition, the new application provides many powerful features including deployment as a web-based, client-server application, leveraging Python packages, JavaScript libraries, and the powerful rendering capabilities of VTK and ParaView. Because trame is web-based, it is a wonderful collaboration tool: simply point collaborators at a URL which can be viewed by any standard web browser.
In the next post, we will begin to describe the trame architecture and implementation patterns in more detail.
References
[1] Kitware Blog Post: Trame: Visual Analytics Everywhere.
[2] Kitware Blog Post: Trame Developer Course.
[3] Oak Ridge National Laboratory. The Virtual Environment for Reactor Applications: VERA.
[4] NEAMS. VERA.
[5] Geir Arne Hjelle. Primer on Python Decorators. Real Python.