Kitware at Supercomputing 2026
At SC26, Kitware will showcase interactive visual workflows designed for large, complex simulations. Our work combines scalable visualization, in situ analysis, AI, GPU computing, and modern application development to support today’s demanding scientific and engineering workflows.
Visit Kitware’s booth to see these capabilities in action and talk directly with our technical team.
Presentation Schedule
 Presentation
The State of Open Source Computer Architecture Simulators: Shared Problems and Community Action
Computer architecture simulators are central to exploring the design space of modern high-performance hardware and analyzing its performance. Many open source simulators exist, targeting different hardware scopes, granularities, and metrics, yet none is perfect: issues with speed, accuracy, and usability limit their effectiveness for architecture researchers, accelerator designers, hardware-software co-designers, and performance engineers, among others. This BoF convenes an expert panel of users and developers from academia and industry to discuss these tools’ shortcomings and possible responses. We invite all who build, use, or depend on these simulators to join the discussion and identify impactful community efforts, with outcomes shared publicly.
 Demo
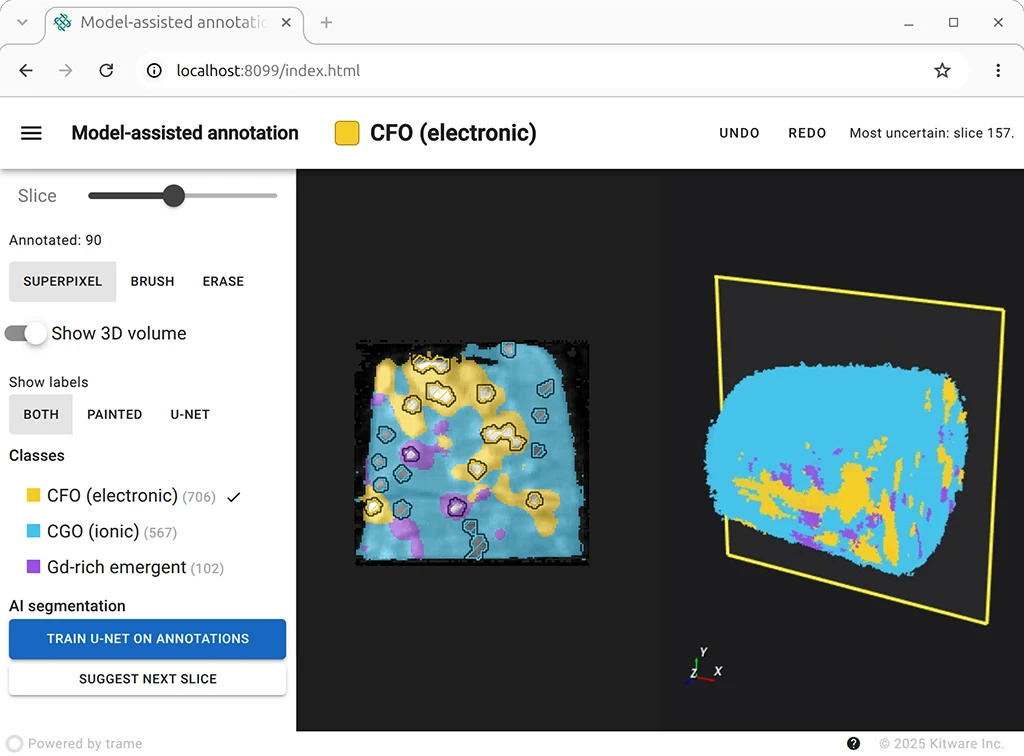
AI for Science with tomviz-web
Ask an AI agent to explore 3D microscopy data and watch it drive tomviz-web, an interactive web application. Then flip the loop: mark up a few images in tomviz-web, and an AI model applies that guidance across the whole dataset.
 Demo
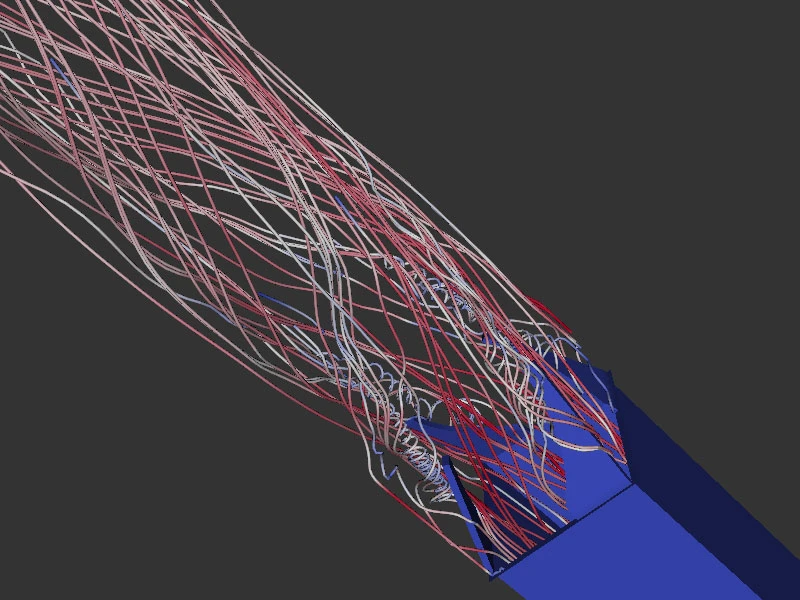
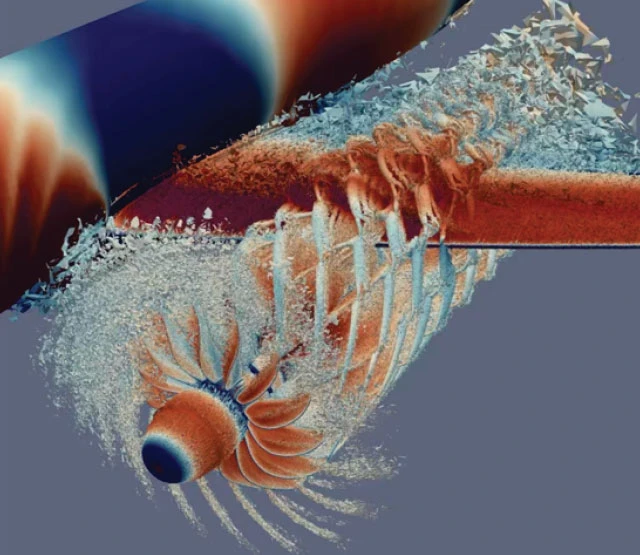
GPU-Enabled Visualization
See how GPU computing can support more robust, highly interactive visualization and analysis for demanding scientific datasets.
 Demo
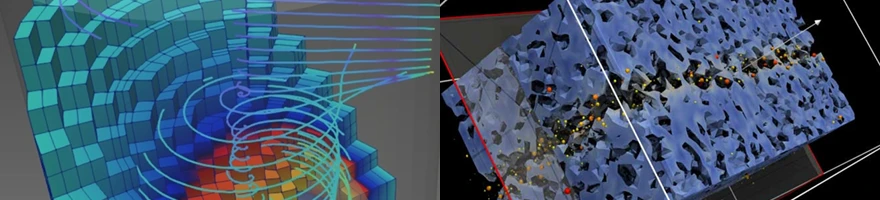
Catalyst and In Situ Workflows
Explore approaches for bringing analysis closer to running simulations to reduce data movement and post-processing bottlenecks.
Scalable Simulation Analysis
As simulations grow in size and complexity, visualization and analysis must scale with them. Kitware builds scalable pipelines for large datasets, complex results, and demanding computational environments. We design these workflows to maintain interactivity and analytical depth as workloads increase, so scientists and engineers can continue to explore, validate, and understand simulation results efficiently.
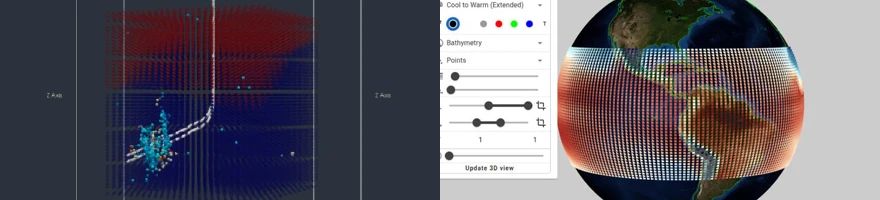
Data Movement Optimization
Moving large volumes of simulation data can put significant pressure on storage, I/O, and downstream analysis. Kitware redesigns data workflows to reduce unnecessary movement and make better use of available computing resources. We look at how data is generated, moved, stored, and analyzed to create more efficient workflows from simulation through post-processing.
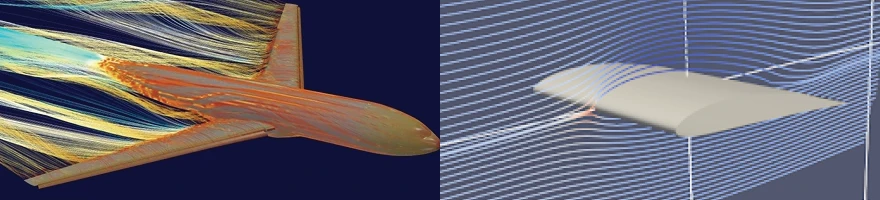
Simulation-to-Decision Workflows
Modern HPC workflows depend on more than simulation performance alone. Kitware connects computation with analysis, AI, and decision-making so results can move more efficiently through the full workflow. By reducing bottlenecks between these stages, we help shorten the path from simulation output to useful scientific and engineering insight.
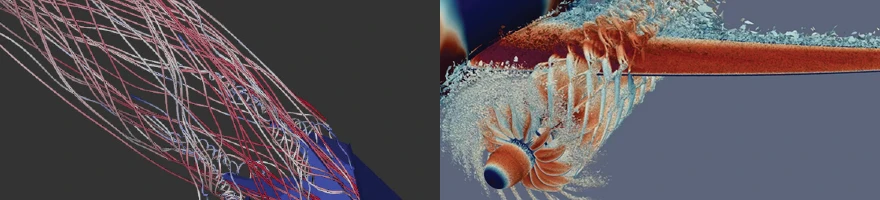
In Situ Analysis
ParaView Catalyst brings analysis into the simulation workflow so data can be examined and processed as it is generated. Kitware integrates Catalyst into existing simulation environments and identifies where in situ analysis can provide the most value. This can reduce reliance on traditional post-processing and support scalable analysis for demanding HPC workloads.
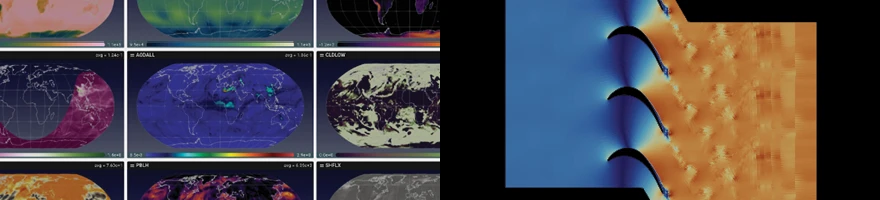
Interactive Visual Workflows
Computation, visualization, and interaction are often handled as separate stages, which can make scientific workflows harder to manage. Kitware designs visual workflows that bring these capabilities together around the needs of the application. This gives teams a more connected way to explore data, understand results, and carry out analysis.
Web-Based Simulation Monitoring
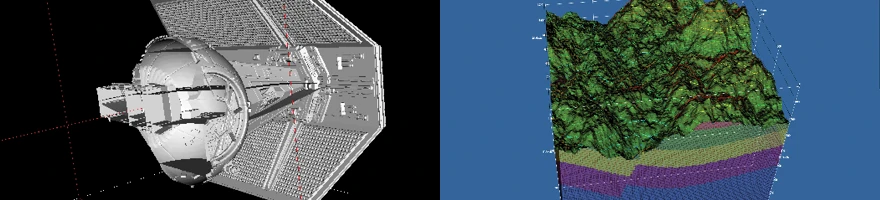
Trame and Catalyst make it possible to monitor simulation results through a web browser using remote rendering. Kitware builds web-based workflows that provide access to live visualization across devices without requiring specialized client software or a powerful GPU on every machine. This makes simulation monitoring more accessible while keeping the computational work close to the resources where it is running.
Related Projects
Talk With Kitware
Whether you are modernizing your simulation platform, introducing AI, or addressing bottlenecks, Kitware can help.
"*" indicates required fields