Tomviz 3.0 Released: A Reimagined Pipeline for Tomographic Data Analysis
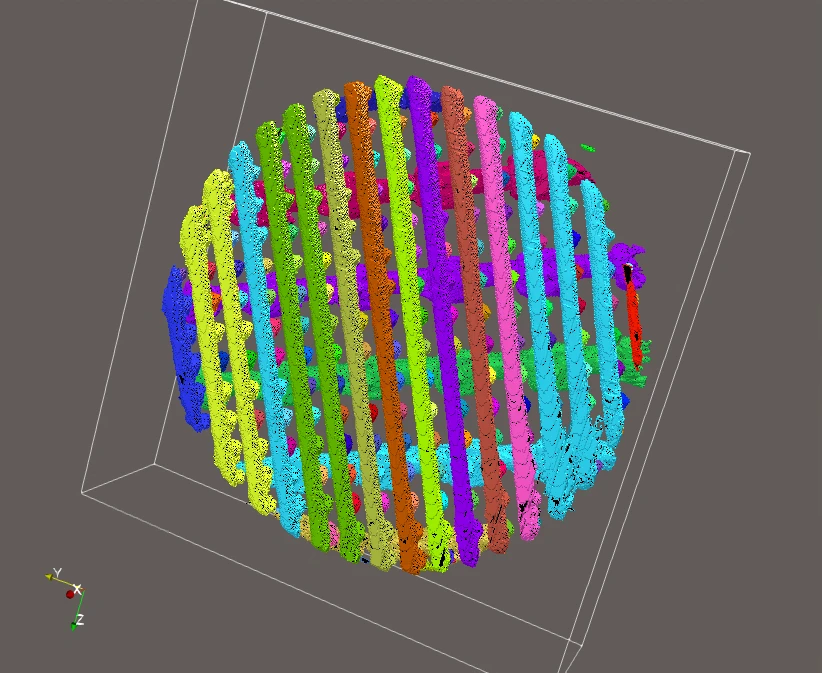
We are pleased to announce the release of Tomviz 3.0, the biggest release in the history of the project. Tomviz is a free, open source, cross-platform application for the reconstruction, visualization, and analysis of 3D tomographic data, developed openly on GitHub and distributed under the 3-clause BSD license.
Tomviz 3.0 is the culmination of more than a year of intensive development. The biggest change is the introduction of a new graph/node based data pipeline. Also included in this release are GPU-accelerated reconstruction transforms, native multi-array volume support, AI segmentation transforms, synchrotron facility workflows, and a fully modernized technology stack.
A Redesigned, Node-Based Pipeline
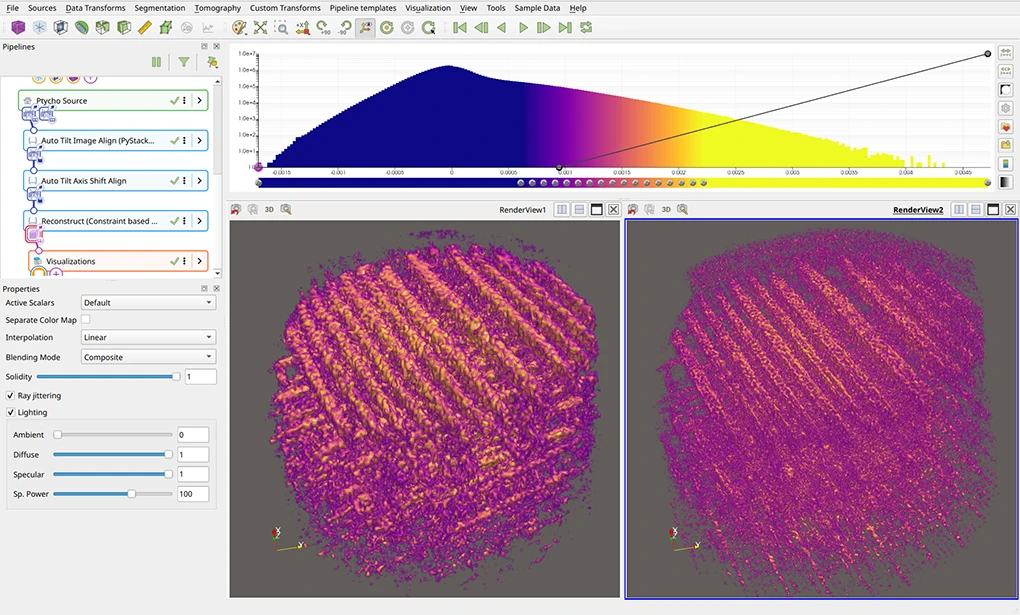
The pipeline has been rebuilt from the ground up as a graph of nodes that have typed input and output ports, and are connected to each other via links. Nodes can have any number of inputs and outputs. Connectivity is also very flexible, with output ports being allowed to be connected to multiple downstream inputs.
Terminology in the menus and in the documentation was refreshed: pipeline nodes that have no inputs and only produce outputs are referred to as “Source Nodes”, nodes that have both inputs and outputs are referred to as “Transform Nodes”, and nodes that have inputs but don’t have any outputs are referred to as “Visualization Nodes”. If we take a look at the terminology used in previous versions of Tomviz, “Operators” are now “Transforms”, “Modules” are now “Visualizations” and “Workflows” are now “Sources”.
A new vertical pipeline widget provides an interactive visual representation of the pipeline: you can create and delete links, insert nodes before an existing step, branch the analysis into parallel paths, and merge branches back together, all with a few clicks.
Execution is now fully under your control. Pipelines can be paused, stopped, and resumed with live progress reporting, and a breakpoint can be set on any transform to halt execution at that point while you inspect or adjust parameters. Intermediate results may optionally be cached, in memory or on disk, so downstream changes no longer force a full re-run of the whole pipeline, and visualizations update live as data flows through.

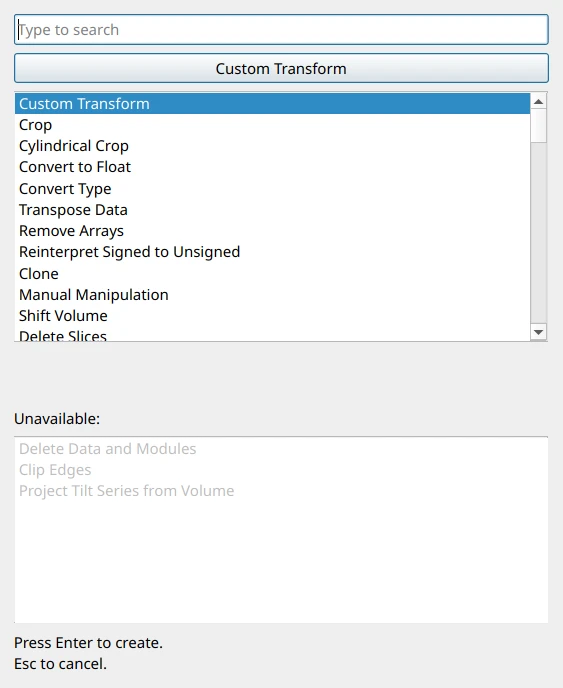
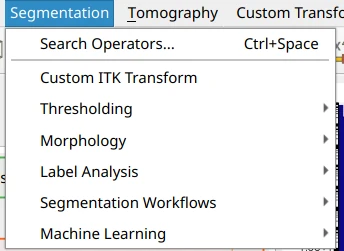
The Data Transforms, Segmentation, and Tomography menus are organized into logical subcategories, each with a ParaView-inspired search dialog for quickly finding the transform you need. Data and state files can now be loaded simply by dragging them onto the application window.
Run Any Transform in Any Environment
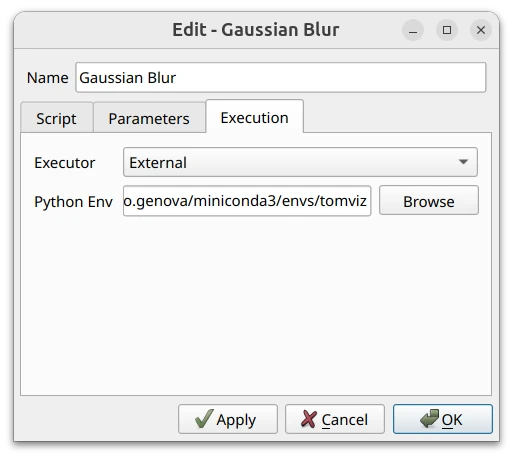
Tomviz 3.0 introduces an external pipeline architecture: any individual transform node can execute outside the application in a conda environment of your choice, on a per-node basis. Heavy or conflicting dependencies, such as GPU frameworks and machine-learning stacks, stay out of the Tomviz application itself while their results flow through the same pipeline as everything else. Each Python transform dialog now has an Execution tab where the environment is selected.
AI Segmentation with SAM 2 and SAM 3
As the first showcase of the external pipeline architecture, Tomviz 3.0 ships two AI segmentation transforms built on Meta’s Segment Anything models. Both run in dedicated conda environments and sit alongside the classical segmentation, thresholding, and labeling transforms in the same pipeline.
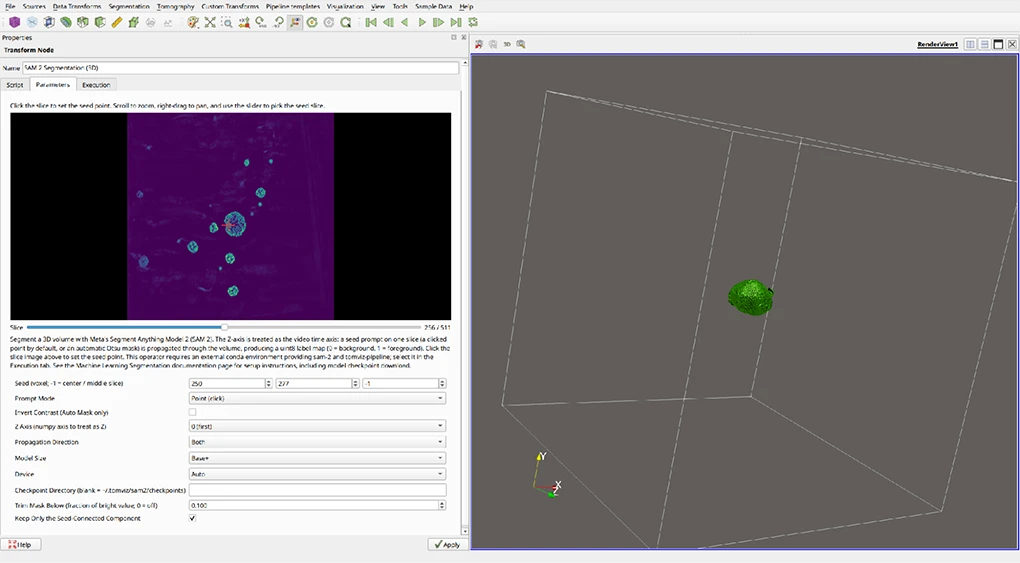
SAM 2 Segmentation (3D) treats the volume as a video: click the feature you want directly on a slice in the transform dialog, and SAM 2 propagates the segmentation from that seed slice through the rest of the volume in both directions. Built-in drift cleanup keeps the result to just the seeded object, and the transform runs on all platforms, using CUDA, Apple Silicon, or the CPU.
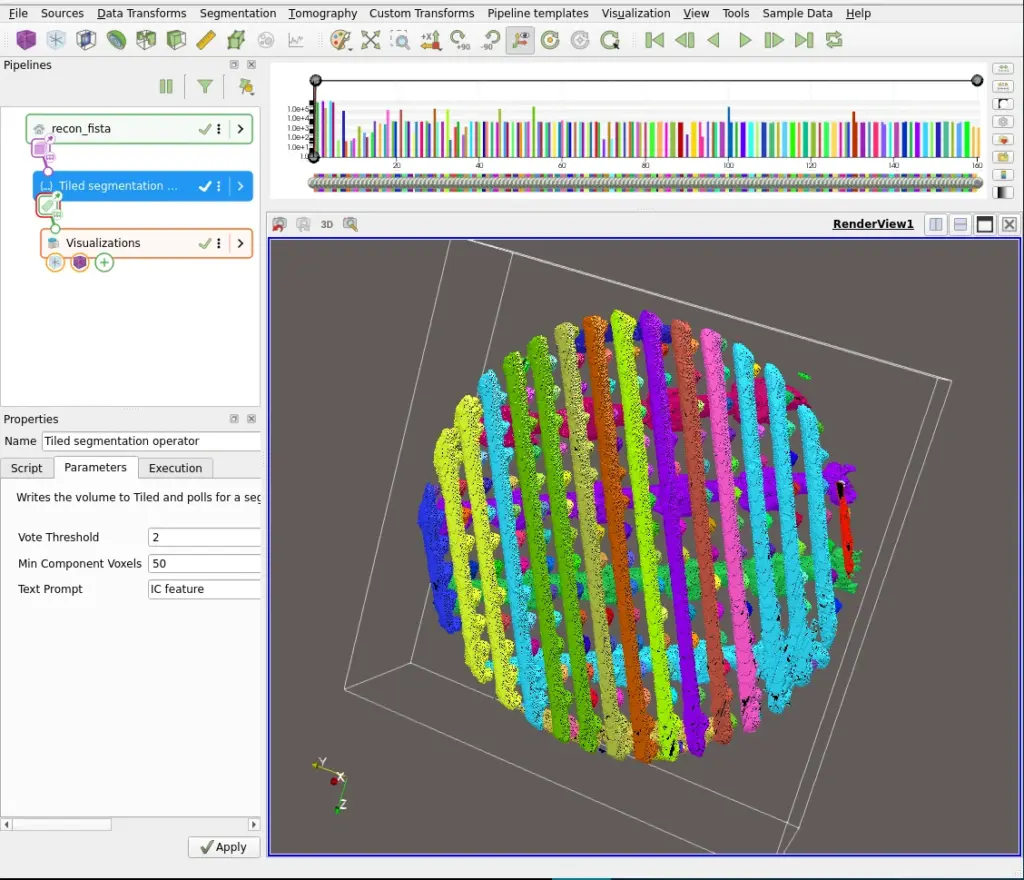
SAM 3 Segmentation (3D) requires no seed at all: describe the feature with a text prompt, and every slice is segmented along all three axes, with a voting step combining the per-axis masks and connected components labeled as separate instances. It runs locally on NVIDIA GPUs, and Tomviz also has the capability to run segmentation on a remote, facility-hosted service instead of the local machine; this is deployed at NSLS-II.
Faster, Better Reconstruction
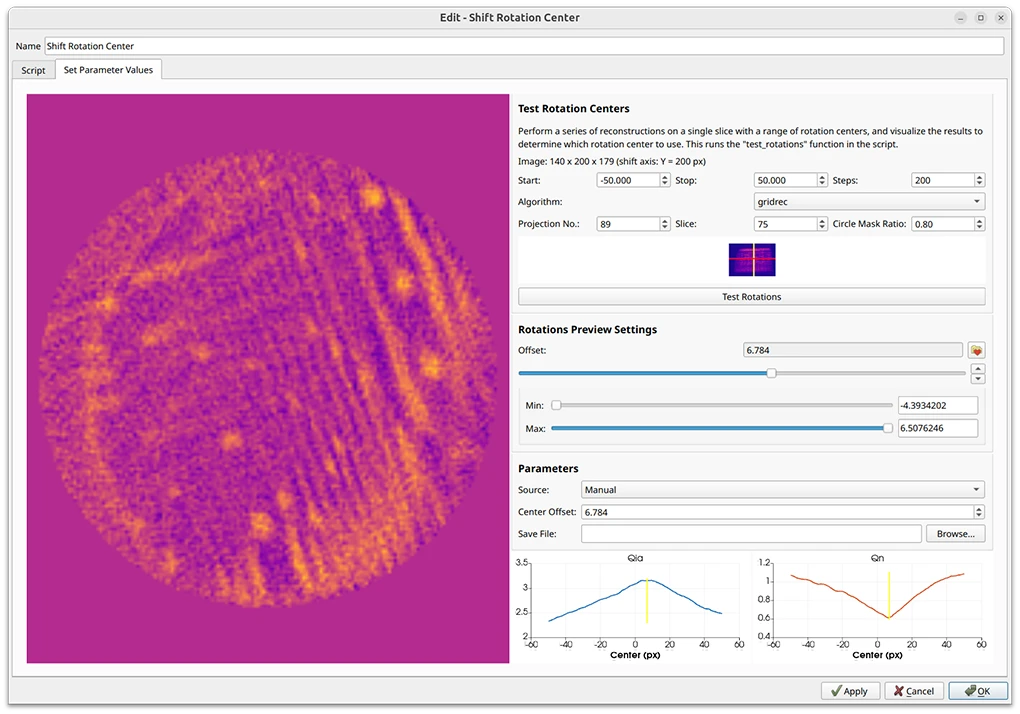
Reconstruction received major attention in this cycle. New SIRT, ART, and TV minimization transforms join the existing methods, and a generalized TomoPy reconstruction transform provides SIRT, ART, TV, and MLEM with optional CUDA GPU acceleration for SIRT and MLEM. An interactive rotation-center tool previews reconstructions across a range of candidate centers, in physical units, so you can dial in the correct value before committing to a full reconstruction.
Native Multi-Array Support
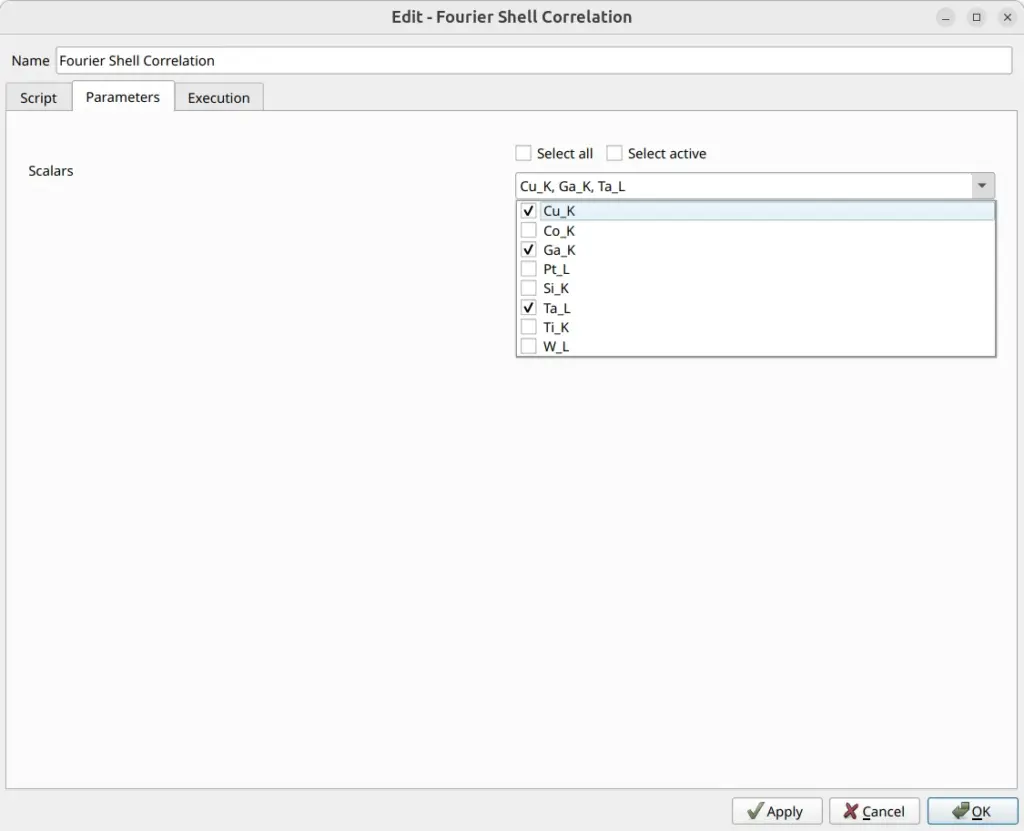
Datasets in Tomviz can now carry many scalar arrays, such as one array per element in an X-ray fluorescence map, and the application understands them everywhere. Transforms have the ability to optionally be applied to any number of arrays in a dataset; visualizations can color by any array by selecting the Active Scalars in their properties.
Synchrotron Facility Workflows: XRF and Ptychography
Tomviz 3.0 includes built-in sources for X-ray fluorescence and ptychography data, developed in collaboration with the HXN beamline at NSLS-II, Brookhaven National Laboratory. The PyXRF source runs full XRF fitting in its own environment, ingests data by scan ID, and loads every extracted element as an array of a single dataset. The ptychography source stacks reconstructed projections, reads pixel sizes from the source files, and can load phase and XRF channels together for correlative analysis.
Improved Alignment Tools
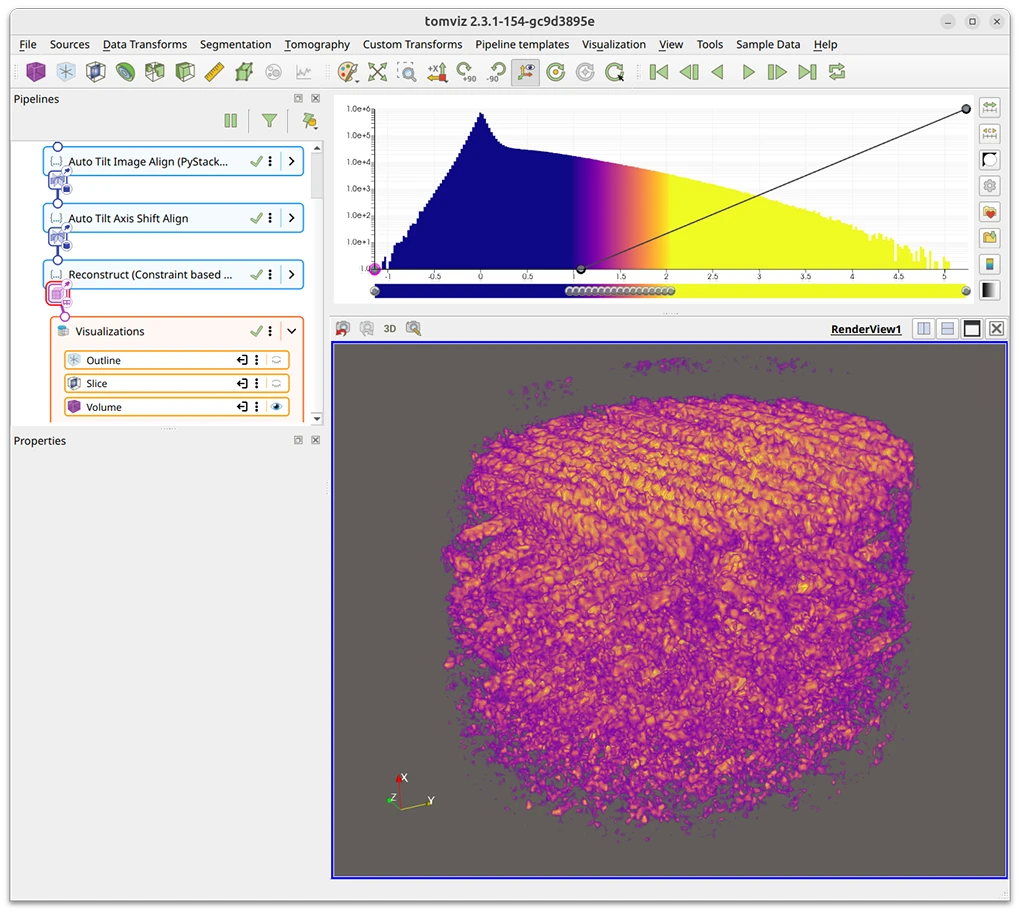
A new PyStackReg transform provides automatic image registration of tilt series, joining improved cross-correlation and tilt-axis alignment transforms that now handle multi-array data and normalize each array independently. Shift alignments can be saved to disk and reloaded, so a careful manual alignment never has to be repeated.
Interactive Plotting and Quantitative Analysis
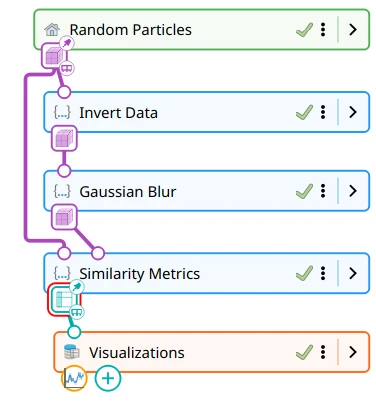
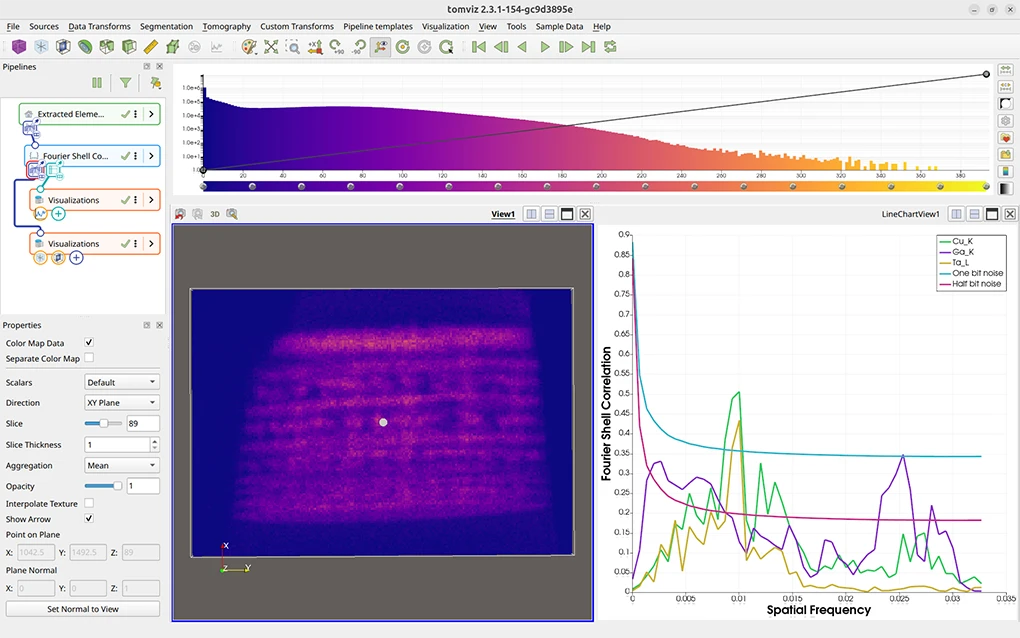
Pipelines are no longer limited to images and volumes: nodes can now produce table outputs, and a new plotting visualization displays them as line charts directly in the application, with transform-supplied axis labels, optional log scaling on either axis, automatically generated plot colors, and CSV export for further analysis or publication. Two new quantitative transforms are provided as examples: “Fourier Shell Correlation” and “Power Spectral Density”. The new Similarity Metrics transform shows the pipeline and plotting working together: it takes two volumes as input, something the old single-input pipeline could not express, and produces a table of metrics comparing them.
New Formats and Usability Improvements
This release also brings a long list of quality-of-life improvements, including:
- .npy and .mat file reading, an MRC writer, and reading and writing of Enhanced (single-file) DICOM volumes.
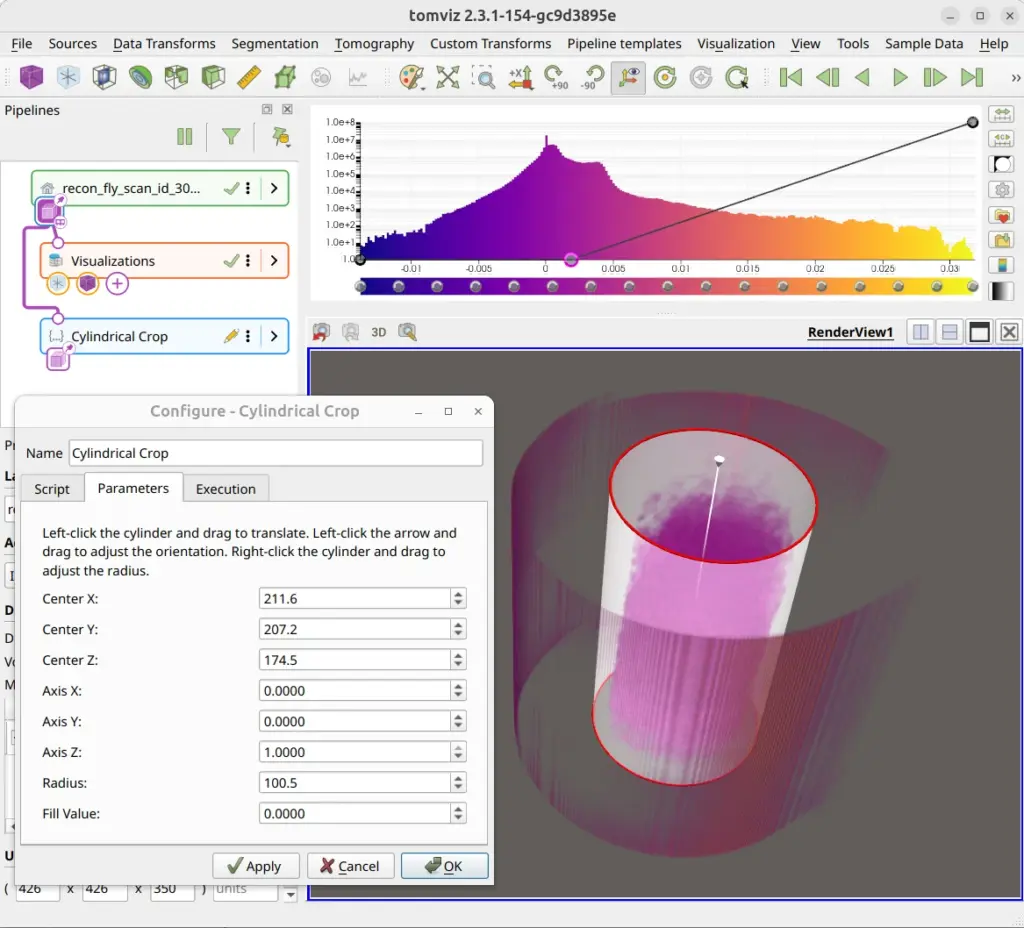
- An interactive 3D cylindrical crop widget.
- Built-in data generators for constant datasets, random particles, and electron beam shapes.
- Voxel sizes displayed in the Data Properties panel, and tilt angles saved to text files.
- A segmentation colormap generator and improved brightness and contrast controls.
A Modernized Foundation
Under the hood, Tomviz 3.0 has been ported to Qt 6 and rebased on the latest ParaView (6.1), with an upgrade to pybind11 3.0 and support for recent Python versions. The release also includes a large number of stability improvements, from fixed memory leaks to eliminated crashes, backed by continuous integration that now builds and tests on Linux, macOS, and Windows.
What’s Next
Tomviz 3.0 is a foundation for what comes next: a trame-based web application for remote and in-browser analysis, deeper multivariate analysis, and expanded AI-assisted reconstruction and segmentation. If you are attending Microscopy & Microanalysis 2026, join our vendor tutorial, “Tomviz 3.0: A Reimagined Open Source Pipeline for Tomographic Data Analysis,” on Monday, August 3.
Try Tomviz 3.0
Tomviz 3.0 is available for Linux, macOS, and Windows, with documentation and source code available on GitHub. Whether you’re exploring new tomography workflows, integrating Tomviz into your research, or interested in developing new capabilities, the Kitware team is here to help. Contact us to discuss your application, ask questions about Tomviz 3.0, or explore opportunities to collaborate. If Tomviz is useful in your research, please cite Tomviz in your published work.
Free Webinar: Tomviz 3.0: A Reimagined Open Source Pipeline for Tomographic Data Analysis
September 16, 2026 | 12-1pm ET
RegisterAcknowledgments
The Tomviz project was founded as a collaboration between Kitware, Cornell University, and the University of Michigan under DOE Office of Science contract DE-SC0011385. The design of the new multi-input/multi-output pipeline architecture was developed under DOE SBIR Phase II award DE-SC0024765, “Multivariate Volume Visualization and Machine-Guided Exploration in Tomviz,” the same design that will power the upcoming web version of Tomviz. The desktop implementation of the redesigned pipeline, along with the synchrotron capabilities and much of the past year of development, was funded by Brookhaven Science Associates under the Statement of Work “Extending Tomviz for Synchrotron Tomography” in support of NSLS-II at Brookhaven National Laboratory.